3.1.1 The differences and relationships between, data, information and knowledge.
1. Data
What it is:
Data is the raw facts and figures. On its own, it doesn’t have much meaning until it’s organised or processed.
Example (Digital Support & Security):
Imagine a server log that records every login attempt. A single line might look like this: 2025-09-01 09:45:12 | User: JamesF | Login: Failed
On its own, that’s just one piece of data.
2. Information
What it is:
When data is processed, organised, or put into context so it makes sense, it becomes information. Information answers questions like “who?”, “what?”, “where?”, “when?”.
Example (Digital Support & Security):
If you take the server log data and count how many failed login attempts happened in the last 24 hours, you might discover: “There were 45 failed login attempts from 5 different IP addresses on the college’s network.”
This is information because it’s structured and tells you something meaningful.
3. Knowledge
What it is:
Knowledge is when you analyse and interpret the information to make decisions or take action. It answers “why?” and “how?”.
Example (Digital Support & Security):
From the information about 45 failed login attempts from 5 IPs, you recognise a possible brute-force attack on student accounts. You know this because of your training in cybersecurity, which tells you that multiple failed logins from a small set of IP addresses is a common threat indicator.
Using this knowledge, you might:
Block those IP addresses in the firewall.
Alert the IT security team.
Review authentication logs for suspicious activity.
3.1.2 The sources for generating data:
Human (Surveys, Forms)
Humans generate data whenever they give information directly – for example, filling in a form, survey, or feedback questionnaire. This is usually self-reported data (what a person chooses to share).
(Digital Support & Security):
A college IT support team might send students a survey about how secure they feel when using online learning platforms. The answers (Yes/No, ratings out of 5, written comments) are data that can be collected and analysed.
AI and machine learning systems create data as they learn from user behaviour. A feedback loop happens when the AI uses its own output as new input, which can lead to bias or errors being reinforced.
(Digital Support & Security):A cybersecurity monitoring tool that uses machine learning to detect suspicious logins could wrongly flag normal student behaviour (like logging in late at night) as a threat. If those false alarms are fed back into the system as “evidence,” it may become overly strict and block real students from logging in.
Task 1
AI and ML Worksheet Download file Task 2
Create a presentation in your group around AI and ML Download file
Sensors collect data from the environment. They measure physical things like heat, movement, sound, or light.
(Digital Support & Security):
In a server room at college, temperature sensors monitor if equipment is overheating. If the temperature goes above a safe level, the system can trigger an alert to the IT support team before the servers shut down.
Internet of Things (IoT) – Smart Objects
IoT devices are everyday objects connected to the internet (e.g., smart lights, thermostats, security cameras). They collect and send data automatically.
(Digital Support & Security):
A college might use smart security cameras that detect movement and send alerts to the IT team’s dashboard. This data helps keep the campus safe, but IT staff must also secure the devices to stop hackers from gaining access.
Every time someone buys something, signs up for a service, or logs into a system, data is generated. Transactions create a digital footprint.
(Digital Support & Security):
When a student pays for a college esports event online, the system records:
The student’s name
Payment method
Date & time
Items purchased (e.g., entry ticket + team jersey)
This transaction data must be stored securely to comply with data protection laws (like GDPR) and to prevent cybercriminals from stealing card details.
"Data Detectives"
Scenario:
You’re part of a college IT support team. The college wants to improve security and gather data from different sources. Below are some situations.
Task (10 mins):
For each scenario, identify: What is the raw data?
What information can you get from that data?
What knowledge or decisions could the IT team make?
Scenarios:
1 - A survey sent to 200 students asks: “Do you feel safe using the college Wi-Fi?” 120 say Yes, 80 say No.
2 - A machine learning tool notices that a student logs into the network at 2 a.m. every night and flags it as unusual.
3 - A server room temperature sensor records 35°C at 3:00 p.m. (normal temperature should be under 25°C).
4 - The college installs smart locks on computer labs that record every time someone enters or leaves.
5 - The esports society’s online shop records that most students buy merchandise around payday (the 28th of each month)
Extension (5 mins):
Find an example of an IoT device that could be used in a school or esports setting.
Describe what data it collects, what information it provides, and what knowledge the IT team could gain from it.
3.1.3 Ethical data practices and the metrics to determine the value of data:
Ethical Data Practices & Metrics to Determine Data Value
Before we dive into the metrics, remember: Ethical data practice means collecting, storing, and using data responsibly.
This includes:
Getting permission (consent) from users.
Protecting data from cyberattacks.
Not misusing personal information.
Following laws like GDPR (General Data Protection Regulation) in the UK/EU.
Now, let’s explore the metrics used to decide how valuable data is.
Quantity
Quantity refers to the amount of data collected. More data can help identify patterns more accurately.
(Digital Support & Security):
A college IT team collects data from 10 login attempts vs 10,000 login attempts. The larger dataset is more valuable because it shows broader patterns (e.g., which times of day attacks are most common).
Don’t collect more data than necessary – only gather what’s useful (“data minimisation” under GDPR).
Timeframe
Timeframe is about when the data was collected and how long it remains relevant. Recent data is often more valuable than old data.
(Digital Support & Security):
A log of failed Wi-Fi logins from yesterday is more useful for spotting a live cyberattack than logs from 2019.
Don’t keep data longer than necessary. For example, student support tickets might be deleted after a year once resolved.
Source
The value of data depends on where it comes from and how trustworthy the source is.
(Digital Support & Security):
Login data from the college’s own servers = reliable source.
A random spreadsheet emailed by an unknown user = unreliable (could be fake or manipulated).
Always check sources and avoid using stolen or illegally obtained data.
Veracity
Veracity means the accuracy and truthfulness of data. Data full of errors or lies is less valuable.
(Digital Support & Security):
If students fill in a survey about cyber safety and many joke by giving fake answers (“My password is 123456”), the veracity of the data is low, so the results can’t be trusted.
Organisations should clean and validate data, and not mislead people by presenting false or incomplete results.
3.1.4 How organisations use data and information:
Analysis to Identify Patterns
Organisations look at large sets of data to find trends, behaviours, or repeated issues. Patterns help predict future events and improve decision-making.
The IT support team analyses helpdesk tickets and notices that every Monday morning, many students report Wi-Fi login problems. The pattern suggests that systems might need restarting after the weekend.
Google analyses search trends (e.g., millions of people suddenly searching for the same issue). This helps them detect outbreaks of cyberattacks or bugs spreading online.
System Performance Analysis (Load, Outage, Throughput, Status)
Organisations monitor how well their systems are running:
Load – how much demand is placed on the system (e.g., number of users).
Outage – when systems go down or stop working.
Throughput – how much data or traffic can pass through the system.
Status – current health of servers, networks, or applications.
An esports tournament hosted at a college requires fast servers. The IT team monitors server load and bandwidth usage during live matches. If the system slows down, they can add more resources to avoid crashes.
Amazon Web Services (AWS) constantly monitors its cloud servers. If a data centre goes down, traffic is automatically re-routed to another server to prevent downtime for customers.
User Monitoring (Login/Logout, Resources Accessed)
Organisations track user activity to ensure systems are being used correctly and securely.
A college IT team monitors who logs into the Virtual Learning Environment (VLE). If a student logs in from two countries within the same hour, it may indicate a hacked account.
Microsoft 365 monitors user logins across the world. If an account logs in from London and then five minutes later from New York, it may block the login and alert security teams.
Targeted Marketing (Discounts, Upselling)
Organisations use data about customer behaviour to send personalised offers, suggest upgrades, or advertise products people are likely to buy.
A college esports society collects data on what students buy in the online shop. If a student buys a gaming jersey, they might get an email offering a discount on a matching mousepad.
Steam (Valve) analyses what games you play and recommends new titles you’re likely to enjoy. They also send personalised sale notifications to encourage more purchases.
Organisations analyse data to spot risks (threats) or advantages (opportunities). This can relate to cybersecurity, business competition, or legal compliance.
The IT security team compares data about phishing attempts with government alerts from the NCSC (National Cyber Security Centre). If a new type of phishing attack is targeting colleges, they can prepare staff with updated training – turning a threat into an opportunity to strengthen security.
NCSC (UK) collects data on cyber incidents across the country. They publish reports on new cyber threats, which organisations use to improve security and stay compliant with regulations like GDPR.
"Data in Action"
Scenario:
You are working in the IT support and security team for a college esports club. You have access to the following datasets:
1 - Login records: Show that some students are logging in at 3 a.m. from outside the UK. 2 - Server stats: During last Friday’s tournament, the main game server slowed down when 200 players connected at once. 3 - Shop sales: Jerseys sell out every time there’s a big tournament, but headsets don’t sell as well. 4 - Competitor data: Another nearby college just announced a new gaming lab with high-spec PCs.
Task:
1 - Analysis to Identify Patterns:
Which dataset shows a repeated trend?
What pattern do you see?
2 - System Performance:
Which dataset shows a system issue?
What actions should IT take to prevent it happening again?
3- User Monitoring:
What do the login records tell you?
What security risks do they suggest?
4 - Targeted Marketing:
How could the esports club use the shop sales data to increase revenue?
5 - Threat/Opportunity Assessment:
How should the club respond to the competitor’s new gaming lab?
Extension:
Research how a company like Netflix or Amazon uses data to recommend products or detect suspicious activity.
Share your findings with the group.
3.1.5 Interrelationships between data, information and the way it is generated and make judgements about the suitability of data, information and the way it is generated in digital support and security.
What this means
Data = raw facts or figures (numbers, logs, text, clicks, etc.) without context.
Information = processed, organised, and meaningful data that helps people make decisions.
Way it is generated = how the data is collected (e.g. login records, surveys, sensors, monitoring tools).
These three parts are linked together:
The way data is generated determines the type and quality of the data you get.
That raw data needs to be processed and organised.
Once processed, the data becomes information that can be used to make decisions.
If the data is incomplete, biased, or collected in the wrong way, the information may not be suitable for decision-making.
"A College Cybersecurity Incident Response"
Scenario:
A UK college notices that some students’ accounts have been logging in at unusual times. The IT security team collects data from three different sources:
1 - Login/Logout Records (system generated data)
2 - Firewall Logs (network traffic data, showing unusual connections from overseas IPs)
3 - Incident Reports (manually generated by staff when they notice suspicious behaviour)
How the interrelationships work:
Data:
Login records show timestamps, usernames, and IP addresses.
Firewall logs capture packet traffic and potential intrusion attempts.
Staff reports note suspicious emails and students complaining about locked accounts.
Information (processed data):
Combining the login timestamps with IP addresses shows multiple students logging in from a single overseas location at odd hours.
Staff reports confirm phishing emails were sent to many accounts the day before.
Suitability of Data:
Login data: Useful and reliable, but could be misleading if students use VPNs.
Firewall logs: Provide technical detail, but require expertise to interpret.
Staff reports: Subjective, but add valuable context about user behaviour.
Judgement:
The most suitable data in this case is the combination of automated system logs (objective, timestamped evidence) and user-reported incidents (human context). Relying on only one source could lead to misinterpretation (e.g. mistaking a VPN for a hacker).
Real-World Industry Example
NHS Digital (UK Health Service) collects data from hospital IT systems about cyber incidents.
In 2017’s WannaCry ransomware attack, logs showed unusual traffic patterns while staff reported being locked out of systems.
By combining both machine data (network logs, malware signatures) and human-reported issues, NHS Digital was able to coordinate with cybersecurity agencies to restore services and improve future protections.
This demonstrates how data, information, and generation methods must work together to make correct security decisions.
"Data to Information Detective"
1 - Work in pairs or small groups.
2 - Read the case study above about the college cybersecurity incident.
3 - Answer the following questions together (10 minutes):
Data: List two types of raw data the IT team collected. Why is each useful? Information: How did the IT team turn the raw data into useful information? Suitability: Which source of data (login logs, firewall logs, or staff reports) do you think is most reliable for making security decisions? Why? Judgement: If you were the IT manager, what actions would you take based on the information gathered? (E.g., resetting passwords, training, blocking IP addresses.)
Extention:
(Optional challenge if time allows, 5 minutes):
Think of a real organisation (like a bank, online shop, or gaming company).
What kind of data do they collect?
How do they turn it into information?
What threats or opportunities might this create?
Output:
Each group should share one key insight with the class about why it’s important to think about both the data itself and how it’s generated when making digital support or security decisions.
Files that support this week
English:
Reading & comprehension of technical text
Students must read definitions and explanations of data, information, knowledge, the differences and relationships between them. mystudentsite.co.uk
They must understand the sections on “sources for generating data,” “ethical data practices / metrics,” “how organisations use data,” and the interrelationships. mystudentsite.co.uk
Summarising / paraphrasing
In the “Data Detectives” scenarios, students are asked to state: What is the raw data? What information can you get? What knowledge or decisions could be made? Summarising these in their own words is an exercise in paraphrase / condensation. mystudentsite.co.uk
In the “Data to Information Detective” questions: summarisation of case studies and articulating the relationships in their own phrasing. mystudentsite.co.uk
Explanation / justification / argumentation
Students must explain which data sources are useful, how raw data is processed into information, and justify choices (e.g. which data source is most reliable, what decisions to take). mystudentsite.co.uk
They are asked to make judgments (e.g. “If you were the IT manager, what actions would you take?”) requiring reasoned argumentation. mystudentsite.co.uk
The extension task: research a real organisation’s data use and explain how data → information → knowledge in that context. That requires structuring and explaining in prose. mystudentsite.co.uk
Use of precise vocabulary / technical terms
Terms like data, information, knowledge, ethical practices, metrics, veracity, quantity, timeframe, source, system performance, user monitoring, targeted marketing, threat/opportunity assessment, etc., are introduced and must be used in explanations. mystudentsite.co.uk
In students’ writeups, they must use these terms appropriately and integrate them into their reasoning.
Oral / group discussion / sharing
Students work in pairs or groups to discuss scenarios, answer the detective style questions, and then groups share key insights with the class. That involves oral communication skills. mystudentsite.co.uk
The presentation tasks (from other weeks) are implied to continue through the module, so this week’s groundwork supports those.
Assessment:
Learning Outcomes:
Awarding Organisation Criteria:
Maths:
Quantitative reasoning & interpretation
In the “Data Detectives” scenarios, students deal with numeric data (e.g. “120 say Yes, 80 say No”) and must interpret what that raw data tells them as information / patterns. mystudentsite.co.uk
They must reason about how much data (quantity), timeframes (when), veracity, source reliability — these metrics involve comparing numeric or relative magnitudes. mystudentsite.co.uk
Comparisons, proportions, and trends
The scenario about transaction timings (“most students buy merchandise around payday”) suggests patterns over temporal cycles — students can investigate proportions, frequencies over time. mystudentsite.co.uk
The lesson invites pattern detection: e.g. repeated peaks or anomalies in data across datasets. mystudentsite.co.uk
Classification / mapping raw → processed
Students map raw data (logs, sensor readings, survey responses) into processed information (counts, summarised statements). That mapping is a kind of data transformation, which is a numeracy skill. mystudentsite.co.uk
They decide which sources are more “suitable” (in terms of reliability, veracity) — which entails comparing numeric attributes (accuracy, error rates). mystudentsite.co.uk
Logical / structured decision-making
Determining which data sources to trust and which actions to take is a decision process that depends on quantitative judgments (e.g. weighting data, considering potential error) — combining logic and numeracy.
Recognising interrelationships (data → information → knowledge) implies structural / logical ordering as well as understanding dependencies among quantities.
Metrics & measurement concepts
The module introduces metrics for value of data: quantity, timeframe, source, veracity. Each metric can be considered as a measurable attribute. Students must think about how to measure / compare them. mystudentsite.co.uk
The students may (in extension) examine real organisations’ data metrics and compare different measures (e.g. volume of data vs freshness vs reliability).
Stretch and Challenge:
E&D / BV
Homework / Extension:
ILT
→
→
→
→
→
→
Week 2
T&L Activities:
3.2 Methods of transforming data
3.2.1 Methods of transforming data:
When organisations collect data, it is often raw and not immediately useful. To make it valuable, it must be transformed. The main methods are:
Manipulating
Analysing
Processing
Manipulating Data
Changing or reorganising data to make it more understandable or useful. This might include filtering, sorting, or combining data from different sources.
A college IT support team exports login data from the network. At first, it’s just thousands of rows of timestamps and usernames. By manipulating the data (sorting by user, filtering failed attempts), they quickly see which accounts have repeated login failures.
Splunk and Elastic (ELK Stack) are widely used in cybersecurity to manipulate and search through huge log files, making it easier to spot patterns of suspicious behaviour
Analysing Data
Looking at data in depth to identify patterns, trends, or relationships. Analysing moves beyond just reorganising – it’s about making sense of the information.
After manipulating login records, the IT team analyses them and notices that 80% of failed logins happen between midnight and 3 a.m. This unusual pattern suggests a brute-force attack.
IBM Security QRadar analyses logs from multiple systems (firewalls, servers, apps) to detect cyber threats by identifying unusual traffic patterns.
Processing Data
Converting raw data into a different format or structure so it can be used by systems, applications, or people. Processing often involves automation.
A system collects sensor data from a server room (temperature, humidity). This raw data is processed into a dashboard that shows “green, amber, red” warnings. IT staff don’t need to read every number – the processed data tells them instantly if action is needed.
SIEM (Security Information and Event Management) tools like Azure Sentinel automatically process logs from thousands of endpoints and generate alerts for IT teams.
You are part of a college IT security team. Below is some raw login data:
Task:
Manipulating:
Sort the data by username. What do you notice?
Analysing:
Which accounts show suspicious behaviour? Why?
Processing:
Imagine you are designing a dashboard. How would you present this data (e.g., traffic light system, charts, alerts)?
Extension:
Research one industry tool (Splunk, ELK Stack, QRadar, or Azure Sentinel).
Explain: Does it mainly manipulate, analyse, or process data – or all three?
Files that support this week
English:
Reading & comprehension of technical prose
Students must read and understand the descriptions of manipulating, analysing, processing data (how raw data is transformed). mystudentsite.co.uk+1
They must interpret a sample raw dataset (usernames, timestamps, status) and understand the implied narrative. mystudentsite.co.uk
Explanation / description writing
In tasks, students will explain their observations: e.g. “Sort the data by username. What do you notice?” requires them to describe patterns in their own words. mystudentsite.co.uk+1
“Which accounts show suspicious behaviour? Why?” demands reasoning and justification in prose. mystudentsite.co.uk
“Imagine you are designing a dashboard. How would you present this data?” asks them to describe the design and rationale (textually). mystudentsite.co.uk
Inquiry / research & reporting
The extension task: “Research one industry tool (Splunk, ELK, QRadar, or Azure Sentinel). Explain: Does it mainly manipulate, analyse, or process data – or all three?” This requires gathering information from external sources and then writing an explanation in structured form. mystudentsite.co.uk
Use of technical vocabulary
Terms like manipulating, analysing, processing, dashboard, pattern, suspicious behaviour etc. must be used correctly in answers. mystudentsite.co.uk
Students will need to communicate clearly with precise vocabulary when describing what transformations or analyses do.
Logical / sequential narrative
The tasks follow a logical progression (manipulate → analyse → process). Students’ answers can mirror that sequence in writing, helping them practise structuring written argumentation in a logical order.
Assessment:
Learning Outcomes:
Awarding Organisation Criteria:
Maths:
Sorting / ordering
“Sort the data by username.” That is an ordering / sorting operation (alphanumeric sorting). It encourages thinking about ordering rules (alphabetic, timestamp) and how datasets can be reorganised. mystudentsite.co.uk
Pattern detection / trend identification
When students analyse the data to find suspicious accounts, they must look for patterns (e.g. multiple failures by one user, clustering in time). That is numerical / logical pattern recognition. mystudentsite.co.uk
Data filtering / selection
The notion of filtering (selecting subsets of data that meet criteria) is itself a numeracy / data operation (e.g. "only failed logins", "only those with > n failures"). mystudentsite.co.uk+1
When designing dashboard output (e.g. traffic light, chart, alerts), students decide how to map numeric data to visuals (thresholds, ranges). That involves thinking about scales, cut-offs, representation of numeric values visually. mystudentsite.co.uk
Converting detailed raw numeric logs to more digestible summary forms is a form of data aggregation / summarisation (though implicitly).
Classification / categorisation of behaviour
Deciding which accounts are “suspicious” vs “normal” is a classification exercise based on numeric criteria (e.g. number of failed attempts, clustering). This involves thresholding, comparison, logical testing.
Understanding data transformation hierarchy
The underpinning conceptual structure (manipulate → analyse → process) implicitly involves mathematical thinking about stages of transforming data (e.g. reorganising, aggregating, mapping).
Stretch and Challenge:
E&D / BV
Homework / Extension:
ILT
→
→
→
→
→
→
Week 3
T&L Activities:
3.3 Data taxonomy
What is a Taxonomy?
Think of a taxonomy like a family tree, but for data. It’s a way of splitting things into groups so we know what type of data we’re dealing with.
3.3.1 Definition of qualitative and quantitative, its purpose, and how data is categorised
Quantitative
quantitative data – which basically means numbers. If you can count it or measure it, it’s quantitative.
Two Types of Quantitative Data can be
Discrete Data
Discrete means things you can count in whole numbers.
You can’t have half of one, it’s either 1, 2, 3… but not 2.5.
In IT support/security:
How many times a student typed the wrong password.
The number of emails flagged as spam.
How many viruses an antivirus tool finds.
“How many login attempts failed this morning?” and you answer “7”, that’s discrete data.
Continuous Data
Continuous means measurements – and you can have decimals.
In IT support/security:
The server room temperature (22.3°C, 22.4°C, etc.).
Bandwidth speed during an esports match (245.6 Mbps).
CPU load (%) on a computer.
“What’s the server temperature right now?” and it says “23.5°C” – that’s continuous data.
Both are useful, but in different ways:
Discrete data is great for counting events – like how many people tried to hack into your system.
Continuous data is better for monitoring performance – like spotting if your server is overheating or slowing down.
Take Amazon Web Services (AWS) they’re running thousands of servers worldwide they use discrete data to count login attempts and block suspicious ones. At the same time, they use continuous data to monitor server performance. If both types spike at once, they know something is wrong.
Qualitative.
What is Qualitative Data?
Qualitative data is about descriptions, opinions, and categories rather than numbers.
Types of Qualitative Data;
Categorical (or Nominal) Data
Data that can be sorted into groups, but the groups don’t have a natural order.
In Digital Support & Security:
Type of cyberattack: phishing, malware, ransomware, brute force.
Operating system: Windows, macOS, Linux.
User role: student, staff, admin.
It’s like labels – they tell you what “type” something is, but not which one is bigger or better.
Ordinal Data
Data that can be put in a ranked order, but the gaps between them aren’t necessarily equal.
In Digital Support & Security:
Student feedback on password security training (Poor, Okay, Good, Excellent).
So ordinal data has a sense of order, but it’s not really about numbers. “High risk” is more serious than “Low risk,” but we can’t say it’s exactly “two times” more serious.
Quantitative data is great for spotting patterns in numbers – but qualitative data adds the human side:
What people think
How people feel
Why something is happening
NCSC (National Cyber Security Centre, UK):
They collect quantitative data about how many phishing emails are reported but they also collect qualitative data from feedback surveys asking staff how confident they feel spotting phishing emails, by combining the two, they can judge not just how many phishing attempts are happening, but also how well people are prepared to deal with them.
Case Study: College Cybersecurity Awareness
Your college has recently run a campaign to improve cybersecurity awareness among students and staff. The IT support and security team collected both quantitative and qualitative data to see if it worked.
Data Collected:
• Quantitative (numbers):
- 1,200 phishing emails reported in Term 1.
- Only 450 phishing emails reported in Term 2.
- 95% of students logged in successfully without needing password resets.
• Qualitative (opinions/descriptions):
- “I feel more confident spotting phishing emails now.”
- “The password rules are still too complicated.”
- “Training was useful but too short.”
- Risk ratings given by IT staff: Low, Medium, High.
Task Part 1 – Analysis (20 mins, group work)
Work in small groups and:
1. Identify the quantitative data in the case study.
2. Identify the qualitative data in the case study.
3. Explain how each type of data helps the IT team understand the effectiveness of the campaign.
4. Make a judgement: Do the numbers and opinions show the campaign was successful? Why or why not?
Task Part 2 – Research (Homework or 30 mins independent task)
Each group must research a real-world cybersecurity awareness campaign. Examples:
- NCSC “Cyber Aware” (UK)
- Google Security Checkup
- StaySafeOnline.org (US)
- OR another campaign you find.
For your chosen case:
- Find one example of quantitative data they collected.
- Find one example of qualitative data they used.
- Explain how combining both types of data made their campaign stronger.
Task Part 3 – Group Presentation (15 mins prep + delivery in next lesson)
Prepare a 5-minute presentation to share with the class. Your presentation should include:
1. A short explanation of the difference between quantitative and qualitative data.
2. An analysis of the college case study – was the awareness campaign effective?
3. Findings from your research case study.
4. A recommendation: If you were the IT manager, what would you do next to improve cybersecurity awareness?
Tip: Use visuals like graphs (for quantitative data) and word clouds or quotes (for qualitative data).
Extension / Stretch Task
Design your own mini research survey that collects both quantitative and qualitative data about how safe students feel online. Share 3–5 questions (mix of numerical scales and open-ended questions).
3.3.2 Know the definition for structured data, understand its purpose, and understand that quantitative data is structured.
Structured data is data that is organised and stored in a defined format, usually within tables, rows, and columns, such as in databases or spreadsheets. It follows strict rules, which make it easier to enter, store, search, and analyse. Because it is predictable and consistent, structured data can be processed quickly by machines and used to support decision-making
The purpose of structured data is to:
Enable fast access and retrieval – information is easily searchable with SQL queries or filters.
Support accurate analysis – data can be aggregated, compared, and visualised (charts, dashboards, reports).
Improve reliability – stored in databases with validation rules, ensuring accuracy and reducing errors.
Aid security and compliance – structured systems can apply access controls and encryption consistently.
Quantitative data is numerical data that can be measured and counted. It is structured by:
Discrete values – whole numbers, e.g. number of employees.
Continuous values – measured data, e.g. temperature, sales revenue.
Categorical values – numerical codes representing groups, e.g. “1 = Male, 2 = Female” in a HR database.
This data fits neatly into tables where each record (row) contains values across defined fields (columns).
Case Studies
Tesco (Retail)
Tesco uses structured data in their loyalty programme (Clubcard). Customer transactions are stored in databases: product IDs, time of purchase, cost, and store location. Structured quantitative data allows Tesco to identify buying patterns, target promotions, and forecast stock demand.
NHS (Healthcare)
The NHS uses structured patient data – age, blood pressure readings, appointment times – stored in Electronic Health Records. This ensures doctors can quickly retrieve accurate medical histories, track quantitative health measures, and comply with legal standards such as GDPR.
Airlines (British Airways)
Airlines store structured data for bookings: passenger details, flight numbers, seat allocations, ticket prices. Quantitative data (ticket sales, baggage weight, passenger counts) helps them optimise scheduling, revenue management, and compliance with aviation regulations.
Spot the Structure (15 minutes – group task)
Your Challenge
In this task, you will work in small groups to explore different types of data and decide which ones are structured and which are not. Then, you’ll look at how organisations use numbers (quantitative data) to make decisions.
Step 1 – Sort the Data (5 minutes)
You will be given a sheet with different examples of data:
- A shopping list with prices
- A short blog post
- Patient heart rate readings
- A set of photos
- Flight booking details
With your group, sort the data into two piles:
- Structured data (fits into a table, rows, or columns) - Unstructured data (free text, images, videos, anything without a clear format)
Step 2 – Find the Numbers (5 minutes)
From your structured data pile, highlight or circle the quantitative values (numbers, measurements, statistics).
Example: prices on the shopping list, heart rate readings, ticket sales.
Then, discuss:
How could an organisation use these numbers?
What decisions could they make based on them?
Step 3 – Share Your Findings (5 minutes)
Choose one example from your group
Be ready to tell the class:
1. Is it structured or unstructured?
2. What numbers did you find?
3. How could a business or organisation use that information?
What You’ll Learn
By the end of this activity, you should be able to:
- Spot the difference between structured and unstructured data.
- Identify where numbers (quantitative data) appear in structured data.
- Explain how organisations can use structured data to make decisions.
3.3.3 Know the definition for unstructured data, understand its purpose, and understand that qualitative data is unstructured.
Unstructured data is information that does not have a predefined format or structure. It does not fit neatly into tables of rows and columns, and it is often text-heavy, image-based, or multimedia. Examples include emails, social media posts, documents, photos, audio, and video files.
The purpose of unstructured data is to:
Capture rich, descriptive detail – allows organisations to understand opinions, behaviours, and context.
Support decision-making beyond numbers – text, images, and speech can provide meaning that numbers alone cannot.
Enable qualitative analysis – helps to identify themes, trends, or insights in customer feedback, medical notes, or research interviews.
Drive innovation – unstructured data can reveal opportunities for product design, marketing, or service improvement.
Qualitative Data and Unstructured Data
Qualitative data is descriptive, non-numerical data – such as feelings, opinions, and experiences. It is usually unstructured because it cannot be easily measured or placed into rows and columns.
Example: A customer saying “The product was too difficult to set up” in a feedback survey.
Unlike quantitative data (numbers), qualitative data focuses on meaning, reasons, and motivations.
Case Studies
BBC (Media)
The BBC analyses unstructured social media comments, audience feedback emails, and video views to understand what viewers like or dislike. This qualitative data helps shape programme schedules and digital content.
Amazon (E-commerce)
Amazon uses unstructured product reviews and customer questions to improve product recommendations. Sentiment analysis (positive/negative reviews) gives insight into customer satisfaction beyond raw sales numbers.
NHS (Healthcare)
Doctors’ notes, medical scans, and patient feedback are unstructured but essential for care. Analysing this qualitative data helps identify patterns in patient experiences and improve treatment plans.
Supporting Activity (15 minutes – Small Groups)
Title:“Unpack the Unstructured”
Your Challenge
In this task, you will explore different types of unstructured data and think about how organisations can use them to understand people’s experiences and opinions
Step 1 – Identify the Unstructured Data (5 minutes)
You will be given a sheet with examples of data:
- A tweet from a customer about poor service
- A product review from Amazon
- A doctor’s note about a patient’s symptoms
- A video clip description from YouTube
- A company sales report
With your group, decide which examples are unstructured and which (if any) are structured.
Step 2 – Spot the Qualitative Information (5 minutes)
From the unstructured examples, highlight or underline the qualitative details (opinions, descriptions, experiences).
Example: “The app keeps crashing and is frustrating to use.”
Then discuss:
- How could an organisation use this type of feedback?
- What changes or improvements could it lead to?
Step 3 – Share Your Insights (5 minutes)
Pick one example and be ready to share:
1.Why is it unstructured?
2. What qualitative information did you find?
3. How could an organisation act on this information?
What You’ll Learn
By the end of this activity, you should be able to:
Recognise examples of unstructured data.
Understand how qualitative data provides meaning and context.
Explain how organisations use unstructured data to improve services or products.
3.3.4 Know the definition for each representation and understand the representations of quantitative data:
When working with data, it’s important to understand how numbers can be represented and organised. Quantitative data is data that deals with numbers and measurements it tells us how many, how much, or how often.
However, not all numbers behave in the same way. Some numbers are easy to count, some are measured on a scale, and others are used to represent categories or groups. To make sense of this, quantitative data is usually represented in three main forms:
Discrete values
Values you count which can only take certain distinct (usually whole number) values. There are gaps between possible values. Examples: number of students in a class; number of defects in a product; count of hospital visits.
Continuous values
Values you measure, which can take any value within a (possibly infinite) range, including decimals/fractions. There are no gaps between possible values in theory. Examples: height, weight, temperature, time, distance
Categorical values.
Values that represent categories or groups rather than numerical amounts. Sometimes further divided into nominal (no inherent order) and ordinal (order matters, but distances between categories are not necessarily equal). Examples: blood type; customer rating (poor / fair / good / excellent); brand; gender.
Type
Benefits
Drawbacks / Limitations
Good settings / less good settings
Discrete values
Easy to count and understand
Good for summarising how many or how often something happens - counts
Often simpler to work with fewer possible values, often integers
Cannot capture very fine-scale variation (no halves, decimals)
Sometimes artificially coarse: e.g treating continuous phenomena as discrete (e.g rounding) can lose information
May have many possible categories, which makes some analyses harder
Good in attendance counts, inventory, surveys with count questions, defect counts. Less good in measurements where precision matters (e.g in science/engineering: length, weight).
Continuous values
Can capture fine-grained variation, more precise measurements
Allow for more sophisticated analysis (regression, modelling, detecting small differences)
More flexibility in representation (histograms, density plots, etc.)
Greater measurement error possible (precision issues, instrument limits)
Sometimes overkill when only broad categories are needed
Can be harder to interpret meaningfully if decimals dominate or if data is noisy
Good in scientific measurement (physics, biology), health data (blood pressure, cholesterol), environmental monitoring. Less good when people only need broad categories (e.g in a large survey maybe age bands matter more than exact age to the nearest day).
Categorical values
Useful for grouping, classification, segmentation
Cannot always be ordered (if nominal) if ordinal, spacing between categories is ambiguous
Statistical tests and visualisations are more limited (can't do arithmetic on nominal categories)
Too many categories can be unwieldy (e.g too many brands or types)
Good in survey data (preferences, satisfaction levels), branding, demographic classification, marketing. Less good in when precision/quantity matters more, or where categories are too broad or ambiguous.
Examples
To clarify, here are some concrete examples in organisational / real-world settings, showing each type in action, plus mixed use, and evaluation.
Retail company / inventory management
Discrete: Number of units of each product in stock (e.g. 15 chairs, 200 mugs).
Continuous: The weight of a shipment in kg; the size of product packaging (volume).
Categorical: Type of product (furniture vs kitchenware vs electronics); category of suppliers; product color.
Benefit: Using discrete counts allows quick decisions about restocking. Continuous values help with logistics (weight, volume) for shipping. Categorical helps in analysing patterns (which product categories sell best).
Drawback: If continuous measures are too precise (e.g. milligrams) that don’t affect business decisions, they add complexity for little benefit. If categories are too many or poorly defined, comparisons become messy.
Healthcare / Hospitals
Discrete: Number of patients admitted per day; number of surgeries done.
Continuous: Patients' temperature; blood pressure; time taken in surgery; length of hospital stay (in hours).
Benefit: Continuous values allow detecting small changes in vital signs; discrete counts help with capacity planning; categorical allows grouping by disease or risk for policy decisions.
Drawback: Measurement error in continuous values can mislead (e.g. inaccurate blood pressure readings). Discrete counts fluctuate daily and may be influenced by external factors. Some categorical groupings (severity) are subjective.
Education / Schools
Discrete: Number of students in a class; number of books borrowed; number of discipline incidents.
Continuous: Test scores (if measured on continuous scale); time students spend on tasks; percentage marks.
Categorical: Grades (A / B / C / Fail); subject area (Math, English, Science); level of satisfaction in surveys.
Benefit: Discrete and continuous data enable quantitative tracking (progress, comparison). Categorical help with grouping and reporting to stakeholders.
Drawback: Grades (categorical) may hide wide variation in actual performance. Continuous scores may vary slightly due to test difficulty but may not represent real learning. Also, privacy/ethical issues when dealing with precise student data.
3.3.5 Know and understand the properties of qualitative data:
• stored and retrieved only as a single object
• codified into structured data.
3.3.6 Understand the interrelationships between data categories data structure and transformation and make judgements about the suitability of data categories, data structure and transformation in digital support and security.
Files that support this week
English:
Explanation / definitions in prose
Students will need to read and understand definitions of qualitative vs quantitative, structured vs unstructured, categorical, ordinal etc.
They may be asked to rephrase or summarise definitions in their own words (to check understanding).
Written reasoning / justification
In Task Part 1, students identify which data in the case study are quantitative vs qualitative, and then explain how each type helps the IT team. That involves constructing reasoned sentences. mystudentsite.co.uk
Also, the judgment task: “Do the numbers and opinions show the campaign was successful? Why or why not?” — this is argumentative / evaluative writing. mystudentsite.co.uk
In the homework / research component, students are asked to find examples and explain how combining both types of data made their campaign stronger — again, explanation in writing. mystudentsite.co.uk
Oral / presentation skills
Students prepare a 5-minute presentation of their findings (from the case study and their research) to share with the class. mystudentsite.co.uk
They will need to present definitions, their analysis, and recommendations — communicating to peers, possibly using visual aids (graphs, quotes). mystudentsite.co.uk
Use of technical / subject-specific vocabulary
Terms like “quantitative data”, “qualitative data”, “structured data”, “unstructured data”, “categorical”, “ordinal”, “representation” etc. appear, and students will have to use and understand them in context. mystudentsite.co.uk
In writing or speaking, correct usage of these terms helps precision and clarity.
Comparative / evaluative writing
Students are asked to make judgments (e.g. success of campaign, suitability of data types) which require comparing evidence, weighing pros and cons, and writing a persuasive or evaluative argument. mystudentsite.co.uk
Also, in describing the limitations / benefits of discrete, continuous, categorical data, students may be asked to contrast them in prose. mystudentsite.co.uk
Question design / survey writing (extension task)
The stretch task invites designing a mini research survey mixing numerical scales and open-ended questions. That requires crafting good question wording in English (clear, unbiased, well framed). mystudentsite.co.uk
Assessment:
Learning Outcomes:
Awarding Organisation Criteria:
Maths:
Understanding data types / measurement types
Distinguish between discrete (countable whole numbers) and continuous (measurable with decimals) data. mystudentsite.co.uk
Understanding that quantitative data can take various representations (discrete, continuous, categorical) and the properties / limitations of each. mystudentsite.co.uk
Classification / sorting tasks
In group activity “Spot the Structure”: students sort data examples into structured vs unstructured, then highlight quantitative values in structured data. That is a numeracy task (identifying where numbers occur) and classifying numeric vs non-numeric. mystudentsite.co.uk
In another task, “Unpack the Unstructured”: students pick unstructured examples and identify the qualitative (non-numeric) parts, which helps cement understanding of numeric vs descriptive data. mystudentsite.co.uk
Quantitative interpretation / reasoning
In the case study about the cybersecurity awareness campaign: students will interpret numeric data (e.g. 1,200 phishing emails reported in Term 1, 450 in Term 2, 95% logins without resets) — draw conclusions and compare trends. mystudentsite.co.uk
They will reason about what the numeric changes imply and whether the campaign was effective.
Linking quantitative and qualitative data
Evaluating how numbers and opinions / descriptive feedback interact to give a fuller picture: combining numeric trends and narrative insights to make judgments. mystudentsite.co.uk
This encourages thinking about triangulation of data: numbers and words.
In the stretch task (creating a survey), students will choose numerical scales (e.g. 1–5, percent, counts) and think about how to measure perceptions / feelings quantitatively. That is a numeracy design decision. mystudentsite.co.uk
Understanding limitations / trade-offs of measurement
The content asks students to consider benefits / drawbacks of discrete, continuous, and categorical data representations (e.g. precision, interpretability, number of categories). That involves mathematical reasoning about error, granularity, and usefulness. mystudentsite.co.uk
Stretch and Challenge:
E&D / BV
Homework / Extension:
ILT
→
→
→
→
→
→
Week 4
T&L Activities:
Learning Aims and Objectives:
Aim:
Objectives:
1. By the end of this week's page students will be able to demonstrate where to apply specific data types for data that appears in databases, tables or datasets
2. By the end of the week's page students will be able to explain and identify where specific data can be decomporsed and extracted from given scenarios in to appropriate data tables.
3. By the end of the week's page students will be able to demonstrate the process of normalisation and explain the purpose of it in given scenarios situations.
4. By the end of the week's page students will be able to reflect on the interrelationships between data type and data transformation.
3.4 Data types
3.4.1 The definition of common data types, their purpose, and when each is used:
Integer (Whole numbers)
What/why: Whole numbers (no decimal point). Efficient for counting, indexing, quantities, IDs. When to use: Anything that can’t have fractions: number of users, attempts, port numbers, stock counts. Gotchas: Watch out for range limits (e.g., 32-bit vs 64-bit) and accidental division that produces decimals.
Example
Suitable Uses
Not Suitable For
0
Counter start
Currency with pennies
7
Login attempts
Temperatures needing decimals
65535
Network ports (unsigned)
Precise measurements (e.g. cm)
-12
Temperature differences
Real (Floating-point / Decimal)
What/why: Numbers with fractional parts. When to use: Measurements (temperature, CPU load), ratios, scientific values. Gotchas: Floating-point rounding error (binary floating point). For money, prefer fixed-point/decimal types.
Example
Suitable Uses
Notes
3.14
Maths/geometry
Stored as float/double
-0.75
Signal values
Rounding errors possible
72.5
CPU temperature °C
Use DECIMAL for money (not float)
Character (Char)
What/why: A single textual symbol (one character). When to use: Fixed-width codes (Y/N flags), single-letter grades, check digits. Gotchas: In Unicode, a “character” users see may be multiple code points (accents/emoji). Many systems still treat CHAR as a single byte/letter in a given encoding.
Example
Suitable Uses
Notes
'Y'
Yes/No flag
Case sensitivity may matter
'A'
Grade
Encoding/locale may affect storage
'#'
Delimiter symbol
String (Text)
What/why: Ordered sequence of characters (words, sentences, IDs). When to use: Names, emails, file paths, JSON blobs-as-text, logs. Gotchas: Validate length and content; normalise case; be mindful of Unicode, whitespace, and injection risks.
What/why: Logical truth value with two states. When to use: Feature flags, on/off, pass/fail, access granted/denied. Gotchas: In databases and CSVs, Booleans are often stored as 1/0, TRUE/FALSE, Y/N—be consistent when importing/exporting.
Example
Suitable Uses
Storage Variants
TRUE
MFA enabled?
TRUE/FALSE, 1/0, or Y/N
FALSE
Account locked?
Keep consistent across DBs
Date (and Date/Time)
What/why: Calendar date (optionally time and timezone). When to use: Timestamps for logs, booking dates, certificate expiry, backups. Gotchas: Time zones and daylight saving; choose UTC for servers, localise only for display. Use proper date types, not strings, for comparisons and indexing.
Example
Suitable Uses
Notes
2025-09-02
Report date
Use ISO 8601 format
2025-09-02T10:30:00Z
Audit timestamp (UTC)
Store UTC, display in local timezone
2025-12-31T23:59:59+1
Regional display
Avoid treating dates as strings
BLOB (Binary Large Object)
What/why: Arbitrary binary data (files) stored as a single value. When to use: Images, PDFs, compressed archives, firmware, encrypted payloads—when you must keep the bytes intact. Gotchas: Large size affects backups and query speed; consider storing large files in object storage (S3, Azure Blob) and keep only a URL/metadata in the database.
Example
Suitable Uses
Notes
PNG logo bytes
Small media in DB
Mind database size limits
PDF policy document
Immutable file storage
Often better in file/object storage
Encrypted payload
Secure binary storage
Store MIME type, size, checksum for integrity
"Mia's Sandwich Shop"
Task 1.
Using the above video, in small groups of no larger than 3 discuss the issues that the company are having.
Identify what data is being recorded
Suggest/Agree a solution for them.
Task 2.
In your groups identify the tables that might need to appear in a database, use the process of Normalisation as well as the Computational Thinking principles of Decomposition, Abstractions and Pattern Recognition.
Task 3.
Present in your groups the findings from your normalisation.Explain/justify your reasoning around the choices made.
create an infoamtive presentation that discusses and exaplains the the following areas of databases;
What a Primary key is and its function, use examples to further show your understanding
What a Foriegn key is and its function, use examples to further show your understanding
What a Composite key is and its function, use examples to further show your understanding
What a relational database is, and why would you use one.
3.4.2 The interrelationships between structured data, unstructured data and data type.
In today’s digital world, organisations gather information in many different forms – from neatly organised spreadsheets of customer transactions to complex streams of emails, images, and social media posts. To make sense of this, we look at three key concepts: structured data, unstructured data, and data types.
Structured data is highly organised, stored in predefined formats such as rows and columns within a spreadsheet or database. This makes it straightforward to search, filter, and analyse. Examples include account numbers, dates of birth, and purchase amounts.
Structured Data
Organised in a predefined format (rows, columns, fields).
Easily stored in databases (SQL, relational systems).
By contrast, unstructured data has no fixed format or schema, making it harder to process. It includes content such as emails, audio recordings, images, videos, or free-text survey responses. While it carries rich insights, it requires more advanced tools and techniques to interpret.
Unstructured Data
No fixed schema or easily searchable structure.
Stored in raw formats like documents, images, videos, social media posts.
Examples: customer service call recordings, CCTV footage, email bodies.
At the foundation of both lies the concept of data types. A data type defines how a particular piece of information is stored and used – for instance, an integer for whole numbers, a string for text, or a blob for multimedia. Structured systems rely on data types to keep information consistent, while unstructured data is often stored in broader types like text fields or binary objects to preserve its form.
Together, these three elements form the backbone of how data is represented, stored, and ultimately transformed into meaningful information.
Examples in Practice
Scenario
Structured Data
Unstructured Data
Data Types in Play
Banking Transactions
Account ID, amount, timestamp
Call centre audio logs
Integer, DateTime, Blob
Healthcare
Patient ID, diagnosis code, prescription dosage
MRI scans, doctor notes
String, Decimal, Blob
Social Media
Username, post date, likes count
Image posts, videos, captions
String, Integer, Blob, Text
Cybersecurity
Login/logout logs, IP addresses
Suspicious emails, attached files
String, Boolean, Blob
Case Studies
Case Study 1: Healthcare – NHS Patient Records
Structured: Patient demographic data (NHS number, date of birth, appointment dates).
Unstructured: Doctor notes, x-ray images, voice dictations.
Interrelationship: Structured records (like appointment schedules) link to unstructured evidence (x-rays stored as BLOBs). The combination provides a holistic medical history.
Application: AI systems analyse unstructured scans, while SQL systems schedule appointments. Both need data types (integer IDs, date, blob images).
Unstructured: Email attachments, phishing attempts, PDF exploits.
Interrelationship: Structured logs identify when and where data entered; unstructured payloads (attachments) must be analysed with ML tools. Data types (IP as string, timestamp as date, file as blob) define how each element is stored and processed.
Application: SIEM (Security Information and Event Management) platforms like Splunk combine both data types to detect anomalies.
Case Study 3: Retail – Amazon Recommendations
Structured: Order history (user ID, product ID, purchase date).
Interrelationship: Data types underpin storage (strings for reviews, integers for quantities, blobs for images). Machine learning models merge structured purchase histories with unstructured reviews to improve recommendations.
Linked to: Core Paper 2 – Data (1.2.1, 1.2.2, 1.2.3)
Topic focus: Understanding the interrelationship between structured data, unstructured data, and data types
By the end of this 25-minute activity, you will be able to:
1. Differentiate between structured and unstructured data.
2. Identify how data types exist within both forms of data.
3. Explain how these three concepts (structured, unstructured, and data types) interrelate in real-world digital systems.
In digital support and cyber security environments, you’ll often manage both structured and unstructured data.
Understanding how data types fit into these categories helps professionals make decisions about:
- Storage (e.g., database vs cloud object store),
- Processing (e.g., SQL query vs machine learning model),
- Security and access control (structured tables vs open media files).
These ideas are interconnected:
- Structured data relies heavily on defined data types (e.g., Integer, Boolean, Date).
- Unstructured data often contains or implies data types inside its content (e.g., text or images may include embedded timestamps or numbers).
- Effective data transformation or classification depends on identifying and linking these types together.
Discussion Starter
Ask:
“If you were the IT support technician for a hospital, what kinds of data would you need to store?”
Then ask:
“Which of those are structured and which are unstructured?”
Step 2 – The Sorting Challenge (10 minutes)
In Pairs or small groups (2–3 students)
Using the provide mixed dataset samples like the one below, either printed or on screen.
Task Instructions
Each group should:
Categorise each example as: Structured data, Unstructured data, (or Semi-structured data, if appropriate).
Identify the data type(s) found or implied in each example
(e.g., text/string, integer, Boolean, date/time, float).
Draw or describe how structured/unstructured data and data types connect.
Sketch a small diagram showing arrows between:
Structured data → relies on → defined data types
Unstructured data → contains → mixed/hidden data types
Allow 10 minutes.
Each group should explain one example to the class.
Step 3 – Reflection Discussion (7 minutes)
Questions for Reflection
Step 4 – Mini Summary Task (3 minutes)
Writes a short paragraph in your own words to answer:
“Explain how structured data, unstructured data, and data types interrelate in digital systems. Give an example from a real-world situation.”
Example student response:
“Structured data, like a customer database, uses fixed data types such as integers and dates to ensure consistency. Unstructured data, such as customer emails, still contains text and time stamps but lacks a fixed schema. Both can be linked — for instance, a support system may combine structured ticket records with unstructured message logs to identify issues faster.”
Prompt
Expected Thinking
Why do structured data systems (like databases) need strict data types?
How might unstructured data still contain data types?
How does this relationship affect security?
.
How could a cyber analyst make use of both?
.
3.4.3 Understand the interrelationships between data type and data transformation.
In digital support and cyber security roles, you’ll often manage data that comes from multiple sources — databases, websites, sensors, and even user input forms.
For that data to be useful, reliable, and secure, it must be stored in the correct data type and transformed into the right structure or format for use.
The interrelationship between these two ideas — data types and data transformation — is crucial to maintaining accuracy, preventing data corruption, and securing systems from attack.
Understanding Data Types
A data type defines what kind of data can be stored and how it’s processed.
Computers must know how to interpret the information they are given.
Data Type
Description
Example
Typical Uses
String/Text
Letters, numbers, and symbols treated as text.
"James", "Password123"
Names, postcodes, usernames.
Integer
Whole numbers only.
27, 2001
Counting logins, age, quantities.
Float/Real
Numbers with decimals.
3.14, 75.5
Percentages, prices, CPU usage.
Boolean
True/False values.
TRUE, FALSE
Security flags, on/off states.
Date/Time
Stores time and date data.
08/10/2025 13:45
Logging, timestamps.
Think of data types as the “containers” that hold different kinds of information.
Just as you wouldn’t pour soup into a paper bag, you wouldn’t store a date as text if you plan to sort by time later
What Is Data Transformation?
Data transformation means converting, cleaning, or reshaping data so that it becomes usable, accurate, or compatible with another system.
Transformations can include:
Changing data from one type to another (e.g. String → Integer).
Reformatting dates (MM/DD/YYYY → DD/MM/YYYY).
Cleaning messy data (Y, Yes, TRUE → TRUE).
Combining or splitting fields (e.g. First name + Surname → Full Name).
These transformations make data usable, comparable, and secure.
How Data Types and Data Transformation Are Connected?
These two concepts constantly interact:
Example
What Happens
Why the Relationship Matters
Importing survey results from a website where every answer is stored as text.
You need to transform "18" to an integer to do calculations (like averages).
The transformation depends on knowing the target data type.
A user enters their name in a field meant for a number.
Without correct data type validation, this could break the system or cause a security flaw.
The data type restricts what transformations or inputs are accepted.
Merging datasets from two departments with different date formats.
You must transform the date strings to one consistent date/time format.
Correct data typing ensures the merge works accurately.
In cyber security, knowing data types helps prevent:
SQL Injection: A hacker could enter malicious text in a numeric field.
Buffer Overflow: Supplying too much text to a field expecting a smaller data type.
Data Leakage: Incorrect transformations might expose sensitive data.
Proper transformations with correct data typing protect systems from these risks.
You are helping your college’s IT department combine attendance data from two different systems.
One system exports CSV data like this:
Student_ID
Present
Hours
00123
Yes
6.5
Before the data can be analysed, you must:
Convert "00123" → Integer (to remove text formatting and leading zeros).
Convert "Yes" → Boolean TRUE.
Convert "6.5" → Float (so you can calculate averages).
The transformations are only possible if you understand the data types involved.
3.4.4 Be able to make judgements about the suitability of using structured data, unstructured data, data types, and data transformations in digital support and security.
Data Decisions in Digital Support and Security Duration: 30 minutes Level: Pearson T-Level in Digital Support and Security Format: Small group task (3-4 learners) Final Output: Short presentation (3-5 minutes per group)
Learning Objective
By the end of this session, you will be able to:
Make reasoned judgements about the suitability of structured vs unstructured data.
Evaluate how different data types (e.g., integer, string, Boolean, date/time) and data transformations (e.g., normalisation, aggregation, cleaning) impact digital support and security decisions.
Communicate your findings effectively to both a technical and non-technical audience.
Stage 1 - Scenario Briefing (5 mins)
You are part of a digital support and security team at a college that manages:
A ticketing system for IT support requests (structured data). Incident reports written by users and technicians (unstructured data). Network logs collected from servers and routers (semi-structured data).
Your manager has asked you to decide which type of data and data transformations are most suitable for improving the college’s cyber-incident response system.
Stage 2 - Research & Discussion (10 mins)
As a group:
Identify examples of structured, unstructured, and semi-structured data in the scenario.
2. Discuss how data types (e.g., integers, text, Boolean) influence how the information is stored and analysed.
3. Explore what data transformations (e.g., cleaning, filtering, converting formats, normalising) could make the data more useful.
4. Evaluate the benefits and drawbacks of using each data form in the context of:
Use this guiding question:
“Which data type and transformation process gives us the most secure and useful insight for decision-making?”
Stage 3 – Judgement and Decision (10 mins)Create a short decision table or mind map comparing your options.
Data Type / Structure
Example
Transformation Used
Pros for Security
Cons / Risks
Your Judgement
Structured
Ticketing database
Normalisation
Easy to query; consistent
Rigid; may miss details
Suitable for trend analysis
Unstructured
Incident text logs
Keyword extraction
Rich detail
Hard to automate
Supplementary use
Use your table to justify your final judgement about which type(s) of data and transformations are most suitable for the college’s digital support and security needs.
Stage 4 - Mini Presentation (5 mins per group)
Each group presents:
Their chosen data type(s) and transformation(s)
The judgements made and the reasoning behind them
How their approach supports security operations (e.g., faster response, data reliability, GDPR compliance)
Presentation audience: The class (acting as the IT management team).
Extension / Differentiation
Stretch: Ask students to link their decision to real-world tools (e.g., Splunk, Wireshark, SQL Server, Power BI). Support: Provide example datasets and a glossary of data types and transformation methods.
Students are asked to write a short paragraph in their own words:
“Explain how structured data, unstructured data, and data types interrelate in digital systems…” mystudentsite.co.uk
This encourages them to summarise technical content in accessible language.
Explanation / justification
In group tasks, students present their normalisation decisions and justify their reasoning for choices made. mystudentsite.co.uk
In the decision-making task (3.4.4), they produce a short presentation, communicating technical decisions to a non-technical audience. mystudentsite.co.uk
They must explain and identify relationships between concepts (structured vs unstructured, transformations, etc.) in the content. mystudentsite.co.uk
Technical vocabulary use
The content introduces specific technical terms (“data type”, “decimal / floating point”, “BLOB”, “normalisation”, “transformation”) and students must use them correctly.
They must use terms like “structured / unstructured data”, “Boolean”, “date/time”, etc., in discussions and writing. mystudentsite.co.uk
Oral communication / presentation skills
In the group work, students deliver a mini presentation (3–5 minutes) of their findings. mystudentsite.co.uk
They must tailor explanations for both technical and non-technical audiences. mystudentsite.co.uk
Reflection / metacognitive writing
There is a “reflection discussion” built in: students must reflect on the relationships between data types and transformations. mystudentsite.co.uk
The “mini summary task” is also reflective: summarising learnings in own words. mystudentsite.co.uk
Assessment:
Learning Outcomes:
Awarding Organisation Criteria:
Maths:
Maths opportunities
Understanding number types and properties
The lesson covers Integers (whole numbers) and Real / floating-point (decimal) types, discussing where to use them, limitations (e.g. rounding) etc. mystudentsite.co.uk
Students must recognise when a value should be integer vs decimal, and understand fractional parts, rounding error etc. mystudentsite.co.uk+1
Conversions between types / transformations
Converting between string → integer or decimal (e.g. from text data to numeric) is a “type transformation” task. mystudentsite.co.uk+1
Reformatting dates, cleaning messy data, combining/splitting fields (e.g. splitting full name into parts) are forms of data transformation with structural / numerical aspects. mystudentsite.co.uk+1
Data normalisation / structuring
The normalization process involves decomposing data into tables, removing redundancy, deciding how to structure numeric and non-numeric attributes. That involves logical structuring and possibly thinking about dependency, relationships, cardinalities (though more of database theory, but mathematically informed). mystudentsite.co.uk
Recognising which values should be stored as numeric or as text, and how that affects aggregations, comparisons, sorting etc.
Quantitative reasoning / comparisons
In judging which transformations or data types are most “suitable,” students implicitly compare options based on numeric criteria (precision, error risk, storage cost, performance) — e.g. floating vs fixed vs integer precision tradeoffs.
They must reason about the pros and cons (tradeoffs) of different representations, which involves quantitative thinking (which method gives more precise numeric behavior, which is more efficient etc.)
Logical / Boolean reasoning
The Boolean data type (true/false) is itself a mathematical/logical concept; using it in system flags, comparisons, conditional logic. mystudentsite.co.uk
Students must reason about when to use Boolean vs other types, and how Boolean logic underlies many system decisions (on/off, pass/fail).
Stretch and Challenge:
E&D / BV
Homework / Extension:
ILT
→
→
→
→
→
→
Week 5
T&L Activities:
3.5 Data formats
3.5.1 Know the definition of common data formats and understand their purpose and when each is used
In digital systems, data must be stored, exchanged, and interpreted in ways that both humans and machines can understand. To achieve this, information is organised using data formats. A data format defines how data is represented, encoded, and structured. Some formats focus on being lightweight and easy to parse by machines, while others are more human-readable or better suited for specific applications.
Choosing the correct data format is essential: it affects compatibility, performance, storage requirements, and security. For example, structured formats like JSON and XML are ideal for web communication, while simple formats like CSV or text files are better for raw storage or simple data transfer. Encodings like UTF-8 and ASCII ensure that text is represented consistently across devices and platforms.
Definitions, Purposes, and Uses
1. JSON (JavaScript Object Notation)
Definition: A lightweight text-based format for representing structured data using key–value pairs and arrays.
Purpose & Use: Commonly used for web APIs, configuration files, and data interchange between client and server. Easy to read by humans and parse by machines.
Definition: A file containing unformatted plain text, typically encoded in ASCII or UTF-8.
Purpose & Use: Used for notes, documentation, log files, or lightweight storage where structure isn’t required.
Examples: A .txt file storing error logs from a program.
Compatible Software: Notepad, WordPad, VS Code, Notepad++, Linux nano/vim.
3. CSV (Comma-Separated Values)
Definition: A plain text format where rows represent records and columns are separated by commas (or semicolons).
Purpose & Use: Ideal for tabular data (spreadsheets, databases) and for exporting/importing between systems.
Examples:
Name, Age, Department John, 25, IT Sarah, 30, HR
Compatible Software: Microsoft Excel, Google Sheets, LibreOffice Calc, Python (Pandas library), SQL import/export tools.
4. UTF-8 (Unicode Transformation Format – 8-bit)
Definition: A character encoding capable of representing every character in the Unicode standard using 1–4 bytes.
Purpose & Use:Global standard for web and modern applications; supports multiple languages and symbols.
Examples: A UTF-8 file can contain English, Arabic, Chinese, and emojis in the same document.
Compatible Software: Modern browsers, Linux/Windows/Mac OS systems, text editors (VS Code, Sublime), databases (MySQL, PostgreSQL).
5. ASCII (American Standard Code for Information Interchange)
Definition: An older encoding system representing characters using 7-bit binary (128 possible characters).
Purpose & Use: Used for basic text files, programming, and communication protocols where extended character sets are unnecessary.
Examples: ASCII encodes ‘A’ as 65.
Compatible Software: Legacy systems, early internet protocols (SMTP, FTP), C/C++ compilers, terminal applications.
6. XML (eXtensible Markup Language)
Definition: A markup language that uses custom tags to define and store structured data in a hierarchical tree format.
Purpose & Use: Common for configuration files, data interchange, and web services (SOAP, RSS feeds). More verbose than JSON but supports complex structures.
Examples:
Alex 22 student
Compatible Software: Web browsers, Microsoft Excel (XML data maps), Apache web services, Java DOM parsers, .NET applications.
3.5.2 Understand the interrelationships between data format and data
transformation, and make judgements about the suitability of using
data formats in digital support and security.
Files that support this week
English:
Assessment:
Learning Outcomes:
Awarding Organisation Criteria:
Maths:
Stretch and Challenge:
E&D / BV
Homework / Extension:
ILT
→
→
→
→
→
→
Week 6
T&L Activities:
3.6 Structures for storing data
3.6.1 Understand the role of metadata in providing descriptions and contexts for data.
When data is created, stored, or transmitted, it often needs additional information to make it meaningful and useful. This is where metadata comes in. Metadata is often described as “data about data.” It provides descriptions, context, and structure that help people and systems understand, manage, and organise the main data.
Without metadata, a file, dataset, or digital object would just be raw content with no clear meaning. For example, a photo file would only contain pixel data, but metadata can add context such as when it was taken, who took it, the camera settings, and even GPS location. This descriptive information makes data easier to search, retrieve, interpret, and manage.
Definition and Purpose of Metadata
Definition: Metadata is information that describes the characteristics, properties, or context of data. It does not alter the data itself but provides supporting details that enhance understanding and usability.
Purpose:
To give context (e.g., who created the data, when, and why).
To aid organisation and retrieval (e.g., library catalogues, search engines).
To support data governance and security (e.g., permissions, classification).
To provide interoperability across systems (e.g., file sharing between applications).
Roles, Uses, and Examples of Metadata
1. Descriptive Metadata
Role: Provides information about the content.
Use: Used in catalogues, search engines, and digital libraries to help users find resources.
Example: A library entry describing a book’s title, author, and ISBN.
Part 1 – Explore Metadata (10 mins)
In small groups (2–3 students), open different types of files on your computer (e.g., Word document, PDF, photo, or MP3 file).
Right-click the file and check Properties (Windows) or Get Info (Mac).
Record the metadata you can find, such as:
- Author/creator
- Date created/modified
- File size
- Keywords/tags
- Technical details (resolution, encoding, etc.)
Part 2 – Research Case Studies (10–15 mins)
Research one real-world case study where metadata is essential. Examples could include: - Photography – how EXIF metadata (camera settings, GPS location) is used in photo management or digital forensics. - Music/Film – how metadata in MP3s/MP4s allows Spotify or Netflix to categorise and recommend content. - Cybersecurity – how hidden metadata in documents (e.g., author names in leaked Word/PDF files) has exposed sensitive information. - Libraries & Archives – how descriptive metadata helps catalogues and digital archives stay searchable.
Prepare 2–3 key points from your chosen case study to share.
Part 3 – Present Your Findings (10–15 mins)
Each group should prepare a short presentation (3–4 minutes) covering: - Definition: What metadata is in your own words. - Examples: Metadata you found in your own files. - Case Study: The real-world use of metadata you researched. - Impact: Why metadata is valuable in making data more useful and reliable.
Stretch / Challenge Task
Discuss as a group: Can metadata ever be a risk? (e.g., GPS location data in photos uploaded online, exposing personal info).
Suggest one security measure organisations can use to manage metadata safely.
3.6.2 Know the definition of file-based and directory-based structures and understand their purposes and when they are used.
All digital systems must store and organise data in ways that make it easy to access, manage, and retrieve. Two of the most common organisational models are file-based structures and directory-based structures.
A file-based structure focuses on storing data in individual, stand-alone files. Each file is independent and may not directly connect with other files, meaning data can be duplicated or difficult to share between systems.
A directory-based structure is more organised, using folders (directories) and subfolders (subdirectories) to group related files. This hierarchy makes it easier to navigate and manage large sets of data.
Both approaches are still used today, and the choice depends on data complexity, collaboration needs, and the scale of storage required.
File-Based Structures
Definition
A storage model where data is stored in independent files, often with no enforced relationships between them. Each file is self-contained.
Purpose & Use
Simple and low-cost way to store and access data.
Common for personal use, small systems, or applications where data doesn’t need to be shared widely.
Used when performance and simplicity are more important than complex data relationships.
Examples & Case Studies
Case Study 1 – Small Business Accounting:
A local shop saves all its sales records in Excel spreadsheets and stores them as individual files (e.g., Jan_sales.xlsx, Feb_sales.xlsx). This is easy to set up but leads to duplication of customer details and makes cross-checking totals more time-consuming.
Case Study 2 – Medical Practice (Legacy Systems):
An older clinic database saves each patient’s record in a separate file. This makes searching slow and creates issues when patients have multiple files across departments.
Software Examples
Microsoft Excel / Access (file-based storage)
CSV or text files in data logging systems
Legacy business systems
Directory-Based Structures
Definition
A hierarchical storage model where files are grouped into directories (folders) and subdirectories, providing a structured way to organise information.
Purpose & Use
Provides a clear hierarchy and reduces duplication.
Easier navigation and searching across large datasets.
Common in operating systems, enterprise systems, and cloud storage where data is shared and must be controlled.
Examples & Case Studies
Case Study 1 – Corporate File Server:
An IT company uses a shared drive with directories like Projects > 2025 > ClientX > Reports. This makes it simple for teams to collaborate while keeping data well organised. Metadata (permissions, timestamps) helps manage access.
Case Study 2 – University Learning Platform:
A university stores student submissions in directories by course and module (Course > Module > StudentID). This ensures work is easy to locate and secure.
Case Study 3 – Cloud Collaboration (Google Drive/SharePoint):
Teams working remotely store documents in shared directories, ensuring all members see the same updated files without creating multiple versions.
You are going to investigate the difference between file-based and directory-based structures, using the case studies provided. Your task is to show your understanding by applying real-world reasoning and producing a short written or visual response.
Instructions
Part 1 – Compare the Structures (10 mins)
1. Write down two key features of file-based structures.
2. Write down two key features of directory-based structures.
3. Explain in your own words why a small business (e.g., local shop with sales spreadsheets) might choose a file-based structure instead of a directory-based one.
4. Explain why a university or IT company would prefer directory-based storage instead of file-based.
Part 2 – Case Study Scenarios (10 mins)
For each scenario below, decide whether a file-based structure or a directory-based structure would be best. Write 2–3 sentences explaining your choice. Scenario A: A freelance photographer saves all their client photos. Each photoshoot needs to be kept separate but easy to find later. Scenario B: A multinational corporation needs to share HR records across several countries, with access restrictions for different teams. Scenario C: A student keeps lecture notes on their personal laptop. Each week’s notes are saved in Word files.
Part 3 – Reflection (5 mins)
In one short paragraph, explain which structure you personally use most often (on your own computer, cloud storage, or phone).
Why does that structure suit your needs?
Output Options
You can present you work as:
A written response (1–2 pages).
A diagram or mind map comparing file vs directory structures with examples.
3.6.3 Know the definition of hierarchy-based structure and understand its purpose and when it is used.
A hierarchy-based structure is a method of organising data in a parent–child arrangement, where each item (or “child”) is linked to a single higher-level item (its “parent”). This creates a tree-like structure, starting from a top node and branching downward into sub-levels.
For example, in a computer file system:
Each folder (child) belongs to one parent, allowing clear paths and logical navigation.
The main purpose of a hierarchy-based structure is to store and organise data efficiently so that relationships between items are clear and retrieval is straightforward. It:
Simplifies data navigation by using parent–child relationships.
Provides logical grouping of related items.
Supports data inheritance, where lower levels can inherit attributes from higher ones (e.g. file permissions).
Enhances clarity and access control, particularly in operating systems, databases, and organisational structures.
Hierarchy-based structures are commonly used when:
Data has a natural one-to-many relationship (e.g. folders and subfolders, organisation charts, XML data).
Systems require structured navigation or categorisation, such as:
File systems (Windows, macOS, Linux)
Hierarchical databases (e.g. IBM IMS)
XML and JSON data representations
Organisational charts (CEO → Managers → Staff)
Website navigation menus
They are not ideal when data has many-to-many relationships, where relational databases are more suitable.
Understanding Hierarchy-Based Structures
Time: 15 minutes Type: Individual written and visual task Resources needed: Paper or digital document, internet access (optional), pen or drawing tool
Task Instructions
Step 1 – Define (3 minutes)
Write a short definition in your own words explaining what a hierarchy-based structure is.
Include:
The meaning of parent and child relationships.
Why data or information might be organised this way.
(Tip: Think of folders on a computer or how staff roles are arranged in a company.)
Step 2 – Create Your Own Hierarchy (7 minutes)
Choose one of the following real-world examples and draw or outline its hierarchy: Your college folder system (e.g. Courses → Units → Assignments → Files) An organisation structure (e.g. Principal → Department Head → Teachers → Students) A website menu layout (e.g. Home → Courses → IT → T-Level Digital Support Services)
Create a tree diagram showing parent and child nodes.
Label each level clearly, showing how information flows from the top (root) down to the lowest level.
Step 3 – Reflect (5 minutes)
Answer these short reflection questions in complete sentences:
Why is a hierarchy-based structure useful for your chosen example?
What problems might occur if this structure was not used?
Can you think of a situation where a hierarchy structure would not work well? Explain why.
What You Should Submit
By the end of this activity, you should have:
- A short written definition (Step 1)
- A hand-drawn or digital hierarchy diagram (Step 2)
- Three short reflection answers (Step 3)
3.6.4 Understand the interrelationships between storage structures and data transformation.
A “storage structure” describes the way in which data is organised, stored and accessed within a system. It covers how pieces of data relate to each other, how they are grouped, how they are indexed, and how the system retrieves or updates them.
For example, data may be stored in a hierarchical structure (a parent → child tree-like model), in relational tables (rows and columns with keys linking them), in flat file lists, or as graph/network models with many-to-many links.
Each type of structure has its own purpose:
A hierarchical structure allows quick traversal from a “root” node down through levels of children.
A relational structure allows flexible linking of any number of records via keys.
A graph/network structure supports complex interconnections such as many-to-many relationships, loops, or relationships between relationships.
How the data is stored influences many things: how fast it can be retrieved, how easy it is to update, how well it supports analytics, and how maintainable it is.
“Data transformation” is the process of taking data in one format, structure or system and converting it into another format or structure that is required for a different purpose. This process often involves cleaning, normalising, aggregating, changing formats/types, removing duplicates, and mapping fields from one structure to another. TIBCO+2Qlik+2
Here’s what typically happens in a transformation process:
Discovery/mapping – you identify what data you have and how it is organised. RudderStack+1
Transformation operations – you might rename fields, filter rows, aggregate values, join different sources, change data types, restructure the organisation etc. Matillion+1
Loading/storing – you place the transformed data into the destination storage structure so it can be used for its intended purpose (e.g., reporting, analytics, operational system). Qlik
Data transformation is essential because raw data comes from many sources (spreadsheets, logs, databases, XML/JSON files, sensor data) in different formats. Unless it is transformed into a compatible form, it may not be usable.
How Storage Structures and Data Transformation Interrelate
The key point is: the choice of storage structure and the process of data transformation are deeply connected. They influence each other.
Structure informs transformation
If data is stored in a hierarchical model (e.g., a folder tree or XML with nested elements), then any transformation must take into account those parent–child relationships. For example, you may need to “flatten” nested structures into tables, or map them into relational records.
If the storage structure is relational tables, then transformation may involve taking data from flat files or other sources and fitting them into tables with rows, columns and keys.
If data will ultimately be analysed using a particular model (say a data-warehouse star schema), then transformation must output data fitting that structure. The target structure dictates the transformation.
Transformation influences structure
Sometimes organisations decide to change the storage structure (e.g., moving from a hierarchical system into relational tables). That requires data transformation to convert existing data into the new structure.
The nature of transformation (for example, many-to-many joins, creating aggregated summary tables) might lead to an adapted storage structure better suited for that transformed data (e.g., summary tables, data marts).
Performance and accessibility considerations of the storage structure (how fast queries can run, how easily data can be retrieved) may shape how transformation is done (pre-aggregate data vs transform on the fly).
The alignment of both ensures usability
If the storage structure and the transformation process are aligned, data becomes accessible, reliable and meaningful. If they are not aligned, you can run into problems: data might be stored in a structure that makes it hard to transform, or transformations produce data that does not fit the storage model, leading to inefficiencies, errors or unusable data.
For instance:
A business collects customer data in many formats (CSV, JSON, spreadsheets), and wants to load it into a central relational database for analysis. The transformation must convert formats, standardise fields, resolve duplicates, map into relational tables. If the relational structure was not designed to take the data (e.g., missing keys, mismatched fields), there will be trouble.
Similarly, a data warehouse may require data in a specific star-schema structure (fact tables, dimension tables); transformation must build the data into those structures.
Thus, when you design systems or tasks involving data, you need to consider both: what storage structure you’ll use and how you’ll transform data to meet that structure — and they must work together.
Why This Matters in Digital Support Services
For students studying the core of Digital Support Services (and especially the “Security” route element you are creating resources for), understanding this interrelationship is crucial. Because:
Data often comes from disparate sources (different departments, formats, legacy systems). Transforming that data so it can be securely stored and accessed is a key activity.
The storage structure chosen has implications for security (access controls, encryption, retention), for data consistency and for integrity.
Poor alignment between storage structure & transformation can lead to security risks (inconsistent data, non-standard formats, duplication), inefficiencies (longer processing), or data unusability (incorrect reports).
In designing solutions (for example: a logging system, incident response database, reports for security controls), students must understand how to structure data appropriately and how to transform incoming data into that structure.
Files that support this week
English:
Assessment:
Learning Outcomes:
Awarding Organisation Criteria:
Maths:
Stretch and Challenge:
E&D / BV
Homework / Extension:
ILT
→
→
→
→
→
→
Week 7
T&L Activities:
3.7 Data dimensions and maintenance
3.7.1 Know the definitions of the six Vs (dimensions) and understand the six Vs (dimensions) of Big Data and their impact on gathering, storing, maintaining and processing:
Big Data refers to large, complex datasets that traditional data processing tools struggle to handle effectively. The “Six Vs” represent the key dimensions that define Big Data and influence how it is gathered, stored, maintained, and processed. These six dimensions - Volume, Variety, Velocity, Veracity, Variability, and Value - highlight the challenges and opportunities involved in working with massive data collections. Together, they shape the strategies organisations use to collect and manage data efficiently, ensuring it can be transformed into meaningful insights that support business and technological decisions.
Volume
This refers to the sheer amount of data being generated and stored. Modern systems collect data from multiple sources—such as social media, IoT devices, sensors, and business transactions—resulting in massive quantities of data that must be processed. Managing large volumes requires scalable storage solutions such as cloud systems and distributed databases to ensure data can be efficiently stored and accessed when needed.
Variety
Variety relates to the different types and formats of data available. Data can be structured (e.g. databases and spreadsheets), semi-structured (e.g. XML or JSON), or unstructured (e.g. videos, social media posts, and images). Handling such diverse formats requires flexible data management tools capable of integrating, converting, and analysing multiple data types to create a complete picture.
Velocity refers to the speed at which data is generated, transmitted, and processed. In the digital age, data streams in real-time from online transactions, smart devices, and live monitoring systems. Organisations must employ high-speed processing techniques, such as stream analytics and edge computing, to capture and respond to information quickly and make timely decisions.
Veracity
Veracity focuses on the quality, accuracy, and trustworthiness of data. With data coming from various sources, it is crucial to validate and clean it to remove inconsistencies or errors. Poor data quality can lead to false insights, so effective verification and governance mechanisms are essential for maintaining reliability in analysis and reporting.
Variability
Variability concerns the inconsistency and fluctuation of data flows. Data volumes and formats can change unpredictably, especially during peak events like marketing campaigns or global news trends. Systems need to adapt to handle these irregular patterns and ensure stability in storage and processing performance.
Value
Value represents the ultimate purpose of Big Data—extracting meaningful insights that provide real-world benefits. Not all collected data holds equal importance; therefore, identifying data that supports decision-making and business improvement is vital. The true success of Big Data lies in its ability to generate measurable outcomes, such as improving efficiency, customer satisfaction, or innovation.
Case Study: Big Data in the Retail Industry – Tesco’s Smart Data Analytics System
Tesco, one of the UK’s largest supermarket chains, uses Big Data analytics to better understand customer behaviour, optimise stock levels, and improve marketing strategies. Through its Clubcard loyalty scheme, online shopping platforms, and in-store systems, Tesco gathers enormous amounts of data daily. This case study explains how each of the Six Vs applies to Tesco’s operations and decision-making processes.
Volume
Tesco gathers data from over 19 million Clubcard members, capturing details of every transaction, including items purchased, time, location, and payment method. This results in terabytes of data generated each day. To manage this volume, Tesco employs cloud storage and distributed databases to scale up as data grows, ensuring it can process customer insights efficiently.
Impact: Large volumes of data enable Tesco to predict buying patterns and adjust stock levels in real time, reducing waste and improving supply chain efficiency.
Variety
Data comes in many forms: structured data (sales figures, barcodes, inventory logs), semi-structured data (customer emails, loyalty data), and unstructured data (social media posts, customer reviews, CCTV footage). Tesco’s analytics systems integrate these diverse data types to gain a complete understanding of customer behaviour and store performance.
Impact: The ability to combine and analyse multiple data types helps Tesco personalise offers and target promotions more effectively.
Velocity
Tesco processes data at high speed from checkout systems, mobile apps, and online orders. Real-time analytics allow the company to monitor stock movement, detect supply issues, and respond quickly—for example, replenishing fast-selling items before they run out.
Impact: High data velocity enables Tesco to maintain a smooth shopping experience and optimise operations dynamically, ensuring customers always find what they need.
Veracity
Not all data collected is accurate—errors can occur due to scanning mistakes, incomplete customer profiles, or out-of-date information. Tesco employs data validation and cleaning tools to filter out duplicates, check accuracy, and ensure the data it relies on for decision-making is trustworthy.
Impact: Reliable data ensures that business decisions, such as pricing and promotions, are based on accurate insights rather than flawed information.
Variability
Customer buying behaviour changes frequently due to factors such as weather, holidays, or economic conditions. For example, during hot weather, Tesco sees spikes in sales of barbecue items and cold drinks. Data patterns fluctuate, so Tesco’s systems must adapt to handle these surges and seasonal trends.
Impact: By analysing variable data patterns, Tesco can forecast demand more accurately and adjust marketing campaigns accordingly.
Value
Ultimately, Tesco’s Big Data system generates value by transforming information into actionable insights. By understanding what products customers buy, when, and why, Tesco tailors promotions to individual shoppers, enhances customer satisfaction, and increases revenue. It also reduces waste through better inventory management.
Impact: Big Data creates measurable business value by improving efficiency, profitability, and customer loyalty.
Tesco’s use of Big Data demonstrates how the Six Vs influence every stage of data management:
Gathering: Multiple data sources (tills, apps, sensors, social media)
Storing: Cloud-based scalable databases
Maintaining: Data cleaning and validation
Processing: Real-time analytics to extract insights
By addressing the challenges and opportunities of Volume, Variety, Velocity, Veracity, Variability, and Value, Tesco maintains a competitive edge in the retail industry through data-driven decision-making.
Understanding the Six Vs of Big Data
Scenario:
You have been asked by a digital data consultancy company to explore how organisations use Big Data to improve their services and operations. Your manager wants you to demonstrate your understanding of the Six Vs (Volume, Variety, Velocity, Veracity, Variability, and Value) by applying them to a real-world organisation.
Your Task:
You are to work independently to research and create a short written or visual report (around one page or one presentation slide per section) explaining how a company of your choice applies the Six Vs of Big Data in its operations.
You must: 1. Choose an organisation that uses Big Data (for example: Amazon, Netflix, Tesco, NHS, Transport for London, or Spotify). 2. Describe how each of the Six Vs applies to your chosen company - explain what type of data they collect, how they manage it, and what impact it has on decision-making. 3. Explain how the Six Vs affect the organisation’s ability to gather, store, maintain, and process its data.
4. Conclude your task by identifying the value and benefits gained by the organisation from using Big Data.
Presentation Format Options:
You may present your findings in one of the following formats:
- A one-page infographic showing each of the Six Vs with examples.
- A PowerPoint or Google Slides presentation (6 slides minimum - one per “V”).
- A short written report using subheadings for each “V.”
Extension Challenge:
Reflect on the challenges your chosen organisation might face if one of the Six Vs was not managed effectively. For example, what would happen if the data lacked veracity (accuracy) or velocity (speed)?
Time Allocation: 25–30 minutes
Success Criteria:
Each of the Six Vs is clearly explained in relation to a real company.
You use appropriate technical language (e.g., data accuracy, scalability, analytics).
You demonstrate understanding of how Big Data impacts decision-making and operations.
3.7.2 Know the definition of Big Data and understand that it has multiple dimensions.
Big Data is more than just large datasets - it is multi-dimensional, shaped by the Six Vs that define its complexity and usefulness. Each dimension affects how data is collected, stored, processed, and used to create value. By managing these dimensions effectively, organisations like Netflix, Amazon, and Tesco can turn vast amounts of raw information into powerful insights that drive innovation and competitive advantage.
3.7.3 Understand the impact of each dimension on how data is gathered and maintained.
3.7.4 Know the definitions of data quality assurance methods and understand their purpose and when each is used:
Data quality assurance refers to the processes and methods used to ensure that data is accurate, consistent, reliable, and suitable for its intended purpose. These methods are vital for maintaining trust in information systems and supporting effective decision-making. Without quality assurance, data can become misleading, duplicated, or corrupted - leading to costly mistakes in business or digital systems. The key methods include validation, verification, reliability, consistency, integrity, and redundancy management. Each plays a specific role in checking, maintaining, and safeguarding data throughout its lifecycle - from collection and storage to processing and analysis. These methods are applied at different stages depending on the goal: ensuring data entered is correct, confirming it has not changed unintentionally, and maintaining stable, accurate datasets over time.
Validation
Definition: Validation ensures that data entered into a system meets defined rules and criteria. Purpose: It prevents incorrect or incomplete data from being stored. For example, ensuring a date of birth is in the correct format or that an email address contains “@”. When Used: During data entry or import, when new data is collected or updated. Example: An online form that rejects a postcode if it doesn’t match the UK format (e.g., “ME4 4QF”).
Verification
Definition: Verification checks that data entered into a system matches the original source or intended value. Purpose: To confirm that information has been transferred or recorded correctly. When Used: Typically used after data entry or data transfer between systems. Example: Double-entry verification where a user must type an email address twice to confirm accuracy, or comparing paper forms to digital entries.
Reliability
Definition: Reliability measures how dependable and consistent the data is over time. Purpose: To ensure that the same data gives the same results whenever it is accessed or used. When Used: During testing, auditing, or repeated analysis phases. Example: A system that consistently returns the same sales figures when queried shows reliable data.
Consistency
Definition: Consistency ensures that data values remain uniform across different systems or databases. Purpose: It prevents conflicting information from existing in multiple locations. When Used: During data synchronisation, database integration, or migration. Example: A customer’s address should be identical in both the billing and shipping databases.
Integrity
Definition: Data integrity ensures that information remains accurate, complete, and unaltered during its storage or transmission. Purpose: To maintain trustworthy and secure data that has not been tampered with or corrupted. When Used: Throughout the entire data lifecycle, especially during transfers or updates. Example: Using encryption or checksums to confirm that data has not changed during transfer.
Redundancy
Definition: Redundancy involves managing and reducing unnecessary duplication of data. Purpose: To prevent wasted storage space, confusion, or outdated information being used. When Used: During database design or maintenance, such as when normalising data. Example: Removing repeated customer details stored across multiple tables in a database.
Case Study: Data Quality in the NHS Patient Records System
The National Health Service (NHS) manages vast amounts of patient data, from personal details to medical histories. To maintain high-quality, reliable information, the NHS employs strict data quality assurance methods:
Validation is used at the point of entry when staff input patient data into electronic systems. For instance, fields such as NHS number, postcode, and date of birth must follow strict validation rules.
Verification takes place when transferring records between hospitals to ensure information matches across systems.
Reliability is ensured through regular audits that check for missing or duplicate patient records.
Consistency ensures that updates made in one department’s database are reflected across others.
Integrity is maintained through strong encryption and access controls to protect sensitive data.
Redundancy is reduced by using a centralised database that links patient data, preventing unnecessary duplication.
By applying these methods, the NHS ensures patient information remains accurate, secure, and consistent across the UK healthcare system, enabling effective and safe medical care.
Checking Data Quality
Scenario:
You have been asked to act as a Data Quality Analyst for a fictional company, TechHealth Ltd, which stores patient and device data. Your job is to identify and correct poor-quality data in a small dataset.
Task Instructions:
You are to:
1.Review the sample dataset (provided by your teacher or created in Excel/Google Sheets).
2. Identify examples of poor data quality, such as:
- Missing entries (e.g., blank postcodes)
- Duplicated data (e.g., same patient ID repeated)
- Incorrect data formats (e.g., “12/45/2024” as a date)
3.For each issue found, decide which data quality assurance method (validation, verification, reliability, consistency, integrity, or redundancy) could solve the problem.
4. Create a short written explanation or table showing:
- The problem identified
- The appropriate method to fix it
- Why that method is suitable
Extension Challenge:
Suggest two ways TechHealth Ltd could automate data quality assurance in the future (e.g., automated validation scripts, database constraints).
Success Criteria:
You correctly identify at least 3–5 data quality issues.
You match each issue with the correct assurance method.
You clearly explain how each method helps maintain accurate and reliable data.
3.7.5 Know and understand factors that affect how data is maintained:
Maintaining data effectively involves keeping it accurate, up to date, secure, and accessible throughout its lifecycle. Several factors influence how well an organisation can manage its data — including time, skills, and cost. Data maintenance is not a one-off process; it requires continuous monitoring, updating, and validation to ensure the information remains relevant and reliable. Poorly maintained data can lead to errors, inefficiencies, and compliance risks, especially in sectors where accuracy is critical, such as healthcare, finance, or education. Successful data maintenance depends on allocating the right resources, staff training, budgeting for maintenance tools, and dedicating sufficient time to review and update records.
Time
Explanation:
Data maintenance requires ongoing time investment. Regular reviews must be scheduled to update outdated information, delete unnecessary records, and back up data securely. If data is not maintained in a timely manner, it can quickly become obsolete or misleading. Example:
TfL schedules automatic daily updates to its Oyster card usage database to ensure that passenger numbers and travel patterns are current. Impact:
Allocating sufficient time for regular updates prevents the accumulation of errors and supports real-time decision-making.
Skills
Explanation:
Skilled staff are essential for effective data maintenance. Employees need training in data management tools, security protocols, and database systems to ensure that updates and checks are performed correctly. Example:
TfL employs data engineers and analysts trained in database administration, cybersecurity, and analytics tools such as SQL and Power BI. Impact:
Without the right skills, mistakes can occur—such as deleting important data or failing to detect errors—which can damage data reliability.
Cost
Explanation:
Maintaining data has both direct and indirect costs, including software licences, staff wages, security systems, and hardware storage. Organisations must balance the value of maintaining accurate data with the cost of implementing it. Example:
TfL invests heavily in cloud storage and predictive maintenance systems, which reduce long-term operational costs by improving reliability and performance. Impact:
While high-quality data maintenance can be expensive, it saves money in the long term by preventing inefficiencies, downtime, and poor decision-making.
Case Study: Data Maintenance at Transport for London (TfL)
Transport for London (TfL) collects and manages enormous amounts of data daily - including Oyster card usage, contactless payments, GPS bus tracking, and maintenance schedules for underground services. To ensure that this data remains accurate and useful, TfL must balance time, skills, and cost effectively. The data is used to plan routes, predict passenger flow, and manage safety systems. However, without regular maintenance - such as updating route changes, deleting old data, and verifying passenger numbers - the system could become inaccurate, leading to delays, poor planning, and wasted resources. TfL’s ongoing investment in skilled data analysts and automated systems ensures that its transport network runs smoothly and efficiently.
Analysing Data Maintenance Factors
Scenario:
You have been asked to act as a Data Administrator for a company called EcoPower Ltd, which manages renewable energy sites across the UK. The company is facing issues with inaccurate energy output reports and incomplete maintenance records.
Your Task:
You are to work independently to investigate and explain how time, skills, and cost influence the company’s ability to maintain accurate data.
Instructions:
1. Read the scenario carefully.
2. Write a short report (around 250–300 words) that includes:
- An explanation of how each factor (time, skills, and cost) affects data maintenance in EcoPower Ltd.
- Suggestions for how the company could improve its data maintenance processes.
- Examples of digital tools or systems (e.g., cloud storage, automated backups, data validation scripts) that could support efficient maintenance.
3. Conclude by identifying which factor you think is the most important and justify your choice.
Outcome:
By the end of the activity, you will have demonstrated your understanding of:
How time, skills, and cost impact data maintenance.
The practical decisions organisations must make to ensure data reliability.
How to propose realistic solutions for improving data maintenance within a business context.
Success Criteria:
Each factor (time, skills, cost) is clearly explained with examples.
You demonstrate understanding of how these affect data accuracy and accessibility.
You provide realistic and practical recommendations for improvement.
3.7.6 Understand the interrelationships between the dimensions of data, quality assurance methods and factors that impact how data is maintained and make judgements about the suitability of maintaining, transforming and quality assuring data in digital support and security.
Files that support this week
English:
Assessment:
Learning Outcomes:
Awarding Organisation Criteria:
Maths:
Stretch and Challenge:
E&D / BV
Homework / Extension:
ILT
→
→
→
→
→
→
Week 8
T&L Activities:
3.8 Data systems
3.8.1 Know the definition of data wrangling and understand its purpose andwhen it is used.
3.8.2 Know and understand the purpose of each step of data wrangling:
As explained in the previous youtube vidoe Data wrangling is the structured process of transforming raw, messy, and inconsistent data into a form that is reliable, accurate, and ready for analysis. Raw data often contains errors, missing values, and formatting problems that make it difficult to use. The purpose of data wrangling is to take this unrefined information and prepare it so that organisations can confidently draw conclusions, make decisions, or run automated systems. Each step - structuring, cleaning, validating, enriching, and outputting - reduces risk, improves quality, and ensures data is suitable for its end use, whether that is reporting, machine learning, cyber-security analysis, or a business decision. Below we look at these in further detail
Structure
Structuring data is the process of organising raw information into a consistent and logical format (such as tables, fields, rows, and columns). It involves identifying the key attributes, deciding how information should be stored, and creating a shape that supports future tasks like searching, sorting, or linking datasets. Good structuring ensures the data is readable and usable across systems.
Case Study (Structure)
A college collects feedback from students in emails, text messages, and handwritten forms. Before analysing trends in satisfaction, the IT support team extracts the responses and places them into a single structured spreadsheet with columns for Student ID, Course, Rating, Comments, and Date.
Clean
Cleaning involves removing errors, inconsistencies, and unwanted data. This may include correcting spelling mistakes, removing duplicates, fixing formatting issues, filling or removing missing values, and ensuring all data uses the same units (e.g., all dates in DD/MM/YYYY). Cleaning is essential for accuracy, especially when decisions rely on precise information.
Case Study (Clean)
A cyber-security team logs device sign-ins from staff laptops. Some records contain blank usernames, others list the same person twice with slightly different spellings (“J. Smith” vs “John Smith”). Cleaning ensures all entries are standardised so unusual login behaviour can be accurately monitored.
Validate
Validation checks whether the data meets required rules (e.g., numbers within an acceptable range, postcodes in the right format, no negative ages, email addresses containing “@”). This step ensures that the data is logical, realistic, and trustworthy. Validation prevents bad data from entering business systems and causing incorrect results.
Case Study (Validate)
An IT helpdesk collects data on incidents reported by staff. A validation rule prevents users from submitting an incident with a “Resolution Time” longer than 365 days. When an incorrect value (e.g., 8,000 days) appears, the system rejects it and asks for correction.
Enrich
Enrichment adds additional useful information to a dataset by combining it with external or related data. This might include adding geographical data, linking customer records with purchase histories, or attaching risk levels to cyber-security events. Enrichment makes the dataset more meaningful and improves the quality of insights.
Case Study (Enrich)
A retail company collects customer purchase data. To better understand buying habits, they enrich the dataset by attaching customers’ regional information based on postcode. This helps the business identify which areas buy which products most often, supporting marketing and stock planning.
Output
The output stage provides the final, cleaned, structured, and enriched dataset in the correct format for its intended use. This might be a CSV file, a dashboard, a report, a visualisation, or a database entry. The purpose is to deliver the dataset in a form that other systems, analysts, or decision-makers can immediately use.
Case Study (Output)
A college attendance system compiles daily attendance records into a cleaned table. The final output is exported as a CSV file for the safeguarding team, who upload it into a monitoring system that highlights students at risk of persistent absence.
Data Wrangling Challenge - “Fix the Dataset”
Scenario:
You have been given a small sample of messy data from a fictional college’s student contact system. Your task is to act as a data specialist and apply the five stages of data wrangling to make the dataset usable.
Instructions
1. Download or create a simple table (8-10 rows) containing errors such as missing values, inconsistent dates, duplicated names, different phone number formats, and incomplete postcodes.
2. Structure the data
Reorganise the information into clear columns (e.g., Name, Student ID, Phone Number, Email, Postcode).
3. Clean the data
Fix spellings, remove duplicates, correct formats, and fill in values where possible.
4. Validate the data
Apply at least three validation checks (e.g., all emails contain “@”, postcodes use UK format, phone numbers have 11 digits).
5. Enrich the data
Add one new column using an external lookup (e.g., Region based on postcode, or Age Group based on date of birth).
6. Output your final dataset
Export the cleaned, validated, enriched version as a CSV or screenshot.
7. Reflect (3–4 sentences)
Explain the issues you identified and how each wrangling step improved the data.
Expected outcome:
A neat, accurate, structured dataset and a short written reflection demonstrating your understanding of the data wrangling process.
3.8.3 Know and understand the purpose of each core function of a data system:
A data system is more than just a data store; it is a set of interconnected services and functions that allow data to be entered, retrieved, persisted, combined, organised, presented, and improved over time. These core functions ensure that data becomes a useful asset rather than a liability. Without each part working well, data could be missing, inconsistent, inaccessible, or unreliable. For example, if you can’t search it, having tons of data doesn’t help; if you don’t integrate it with other sources, insights are limited; if you don’t produce output, stakeholders can’t act; and if you don’t build a feedback loop, the system can’t improve.
Input
Purpose & Discussion:
The input function is where raw data enters the system. This might be manual user entry, sensors, imports from external systems, or file uploads. The quality, completeness and accuracy of data at the input stage determine how reliable everything else will be. If the input is poorly handled (e.g., wrong format, missing values, incorrect units), the rest of the system will struggle. Good input mechanisms include validation at entry, standardised formats, and controlled sources.
Why it contributes to the system:
It ensures data enters in a usable state rather than chaos.
It sets the foundation for everything downstream: search, save, integrate, etc.
It helps minimise garbage-in problems.
It can enforce business rules at the earliest point (e.g., required fields, format checks).
Simple case study:
A college's student-registration portal allows students to input their details. If the "Date of Birth" is entered incorrectly (e.g., using US format instead of UK), the system might mis-calculate age. By enforcing the format at input, the data system prevents many downstream errors.
Search
Purpose & Discussion:
The search function allows users or systems to find relevant data within the system. It may involve indexing, full-text search, filters, queries, or metadata lookup. Effective search is critical for turning data into actionable information. Without it, data remains trapped and unusable.
Why it contributes to the system:
It makes data accessible and useful to end-users.
It supports efficiency: finding specific records, statistics or patterns.
It supports decision-making, when analysts can retrieve the right data quickly.
It supports other functions (integration, output) by locating relevant records.
Simple case study:
In a customer-services system, a support agent uses the search function to retrieve all tickets logged by a particular user ID. Without good search capability, the agent might miss relevant historical tickets or duplicates, hindering resolution.
Save
Purpose & Discussion:
The save function is about persisting data so it's stored reliably for future use. This involves databases, file systems, cloud storage, backups, and versioning. Its purpose is to ensure data is kept securely, can be retrieved later, and remains intact (integrity) over time.
Why it contributes to the system:
It ensures data remains available and durable.
It supports data continuity (not lost when system restarts).
It enables historical tracking and audit capabilities.
It provides the platform for other functions (search, integrate) to operate on stored data.
Simple case study:
An IT department logs network access events and saves them into a long-term log database. This ensures the data is available for compliance, audits, and forensic investigations. If events weren’t saved reliably, there might be gaps.
Integrate
Purpose & Discussion:
The integrate function brings together data from multiple sources into a coherent whole. This might be combining databases, linking records across systems, performing ETL (Extract, Transform, Load), or joining internal with external datasets. Integration is vital for richer insight-single siloed datasets often tell only part of the story.
Why it contributes to the system:
It enables holistic views of data (e.g., combining sales + support + marketing).
It supports data enrichment (linking related data).
It reduces duplication, overlaps and inconsistencies across systems.
It supports analytics and reporting at a more advanced level.
Simple case study:
A retail organisation merges customer purchase history (from e-commerce database) with support ticket data (from CRM system). By integrating these, the business can see which customers file frequent tickets and correlate this with purchase value, enabling better customer segmentation.
Organise (index)
Purpose & Discussion:
The organise function (often called indexing, categorising or structuring) arranges data so it becomes manageable and efficient. This includes creating metadata, indexes, hierarchies, taxonomies, and classification schemes. Well-organised data is easier to search, retrieve, manage and maintain.
Why it contributes to the system:
It improves performance of search and retrieval (via indexing).
It ensures consistency (categories, taxonomies).
It supports governance and data quality (knowing what each data item means).
It makes maintenance (archiving, purging) simpler.
Simple case study:
A library system indexes each book by author, title, subject and ISBN. Without this indexing structure, finding books would be slow or require scanning all entries; with the index the system can jump directly to relevant records.
Output
Purpose & Discussion:
The output function presents the processed data in a usable form. This could be reports, dashboards, exported files, visualisations, or data feeds to other systems. The goal is to deliver information that stakeholders or other systems can use to act.
Why it contributes to the system:
It turns data into actionable insights.
It supports decision-making and reporting to management.
It enables sharing of data and findings.
It completes the "value chain" of data: from raw to actionable.
Simple case study:
A marketing team receives a dashboard showing monthly website visits, campaign performance and conversion rates. The dashboard (output) is produced from integrated, organised, stored data and helps managers decide budgets and tactics.
Feedback loop.
Purpose & Discussion:
The feedback loop is the mechanism by which the system receives input about its performance or accuracy, and uses that to improve. For a data system this might mean logging errors, monitoring usage, feeding back corrections, re-training models, updating rules, or purging outdated data. It ensures the system adapts and remains fit for purpose.
Why it contributes to the system:
It supports continuous improvement of data quality and processes.
It helps detect errors or outdated information and correct them.
It enables the system to evolve with changing requirements.
It closes the loop between output (what users see) and input/integration (how data is collected or structured).
Simple case study:
After delivering a monthly sales report, the business notices that many entries were mis-labelled. A feedback loop is established where incorrect entries are flagged, the input form is modified to prevent the error, and future reports improve in accuracy and reliability.
"Loan Laptops"
You work for a college’s Digital Support Services team. The college has just launched a new system to track student equipment loans (laptops, tablets). Your job is to map out and apply the core functions of the data system.
Instructions: 1. Input (3 minutes):
Write down what data you would collect when a student borrows a piece of equipment (e.g., Student ID, Equipment ID, Date borrowed, Condition).
2. Search (2 minutes):
Describe how you (or a support staff) might search the system to find all equipment currently out on loan or all loans for a particular student.
3. Save (2 minutes):
State where and how the data will be saved (which database/table, what backups or archiving might be needed).
4. Integrate (3 minutes):
Think of one other system or dataset you could integrate with the equipment-loan data (e.g., student enrolment database, maintenance records). Write what benefit that integration gives.
5. Organise (Index) (3 minutes):
Decide how you would organise and index the loan data so it can be retrieved efficiently (e.g., index by Equipment ID, Student ID, Borrow Date).
6. Output (3 minutes):
Describe one output you would produce for managers (e.g., monthly report of overdue loans, dashboard of equipment utilisation).
7. Feedback Loop (2 minutes):
Explain how you would put a feedback loop in place (e.g., logging errors when items are returned late, updating input form to require condition field, review of lost-item trends).
Submission:
Write your answers in a short document or on a worksheet. Be ready to share which part you found most challenging and why.
3.8.4 Know the types of data entry errors and understand how and why they occur:
Data entry errors are mistakes that occur when information is manually or digitally entered into a system. These errors often seem small-
maybe a mistyped letter or a number in the wrong order-but they can cause major issues for organisations. These problems arise because data systems rely on accuracy: one incorrect value can affect calculations, decision-making, records, reports, and even customer service.
Errors usually happen because humans get tired, distracted, rushed, or misunderstand what data they are supposed to input. Poor forms, unclear labels, or complex interfaces also increase the chance of mistakes. Reflecting on these errors helps us understand how to design better systems, improve training, and reduce risks.
Transcription Errors
A transcription error happens when data is recorded incorrectly during the process of copying, typing, or transferring information from one place to another. This might include copying from a paper form to a database, listening to someone say information, or transferring data between systems.
Why transcription errors occur
Fatigue or distraction
Poor handwriting on original documents
Rushed data entry
Mishearing information
Misreading similar characters (e.g., 0 vs O, 1 vs I)
Examples of transcription errors
Typing “Baker Street” as “Baket Street”
Entering £530.00 as £350.00
Recording a phone number as 07982 613441 instead of 07982 613441
Copying a passport number incorrectly because the handwriting was unclear
In practice
A college administrator enters student enrolment details into the management system. The student’s surname is “Harrington”, but the administrator types “Harington”. This leads to the student’s emails and login details failing to generate correctly, causing delays.
Transposition Errors
A transposition error happens when the correct characters or numbers are used, but placed in the wrong order. This type of error is especially common when dealing with long numbers or codes.
Why transposition errors occur
Typing too quickly
Mis-hitting keys on a keyboard
Losing place in a long numerical sequence
Visual fatigue when reading long codes or IDs
Examples of transposition errors
Entering 81 instead of 18
Typing £1,294 as £1,249
Recording a product code A473B as A437B
Entering a date as 12/03/2025 instead of 13/02/2025
In practice
A library assistant enters book barcodes into the system for inventory. The correct barcode is 496721, but it is entered as 469721. This causes the wrong book to appear as “missing” in the system.
Case Study: Hospital Appointment System Failure
A hospital experienced significant problems due to transcription and transposition errors in its patient appointment system.
Administrative staff manually entered patient NHS numbers, appointment times, and treatment codes.
Several transposition errors occurred where NHS numbers were typed in the wrong order.
Some transcription errors caused patients’ names and dates of birth to be incorrectly recorded.
Consequences
Patients received incorrect letters, including appointment times for different people.
Medical records were temporarily mismatched, risking incorrect treatment plans.
Appointments were missed, leading to delays in diagnosis and treatment.
The hospital faced complaints and had to conduct a large internal audit, costing money, staff time, and reputational damage.
Reflection
This situation highlights that even small errors made during routine data entry tasks can create large-scale risks and operational failures. Good system design, staff training, and automated validation tools are essential to reduce the frequency and impact of these mistakes.
3.8.5 Know and understand methods to reduce data entry errors:
Data entry errors occur when information is typed, selected or recorded incorrectly within a system, database, spreadsheet, or form. These mistakes can include typing the wrong value, selecting the wrong option, missing data, or even entering information in the wrong field. Although some errors might seem small, they can lead to serious issues such as inaccurate records, poor decision-making, failed transactions, incorrect reporting, or even legal and compliance breaches—especially in professional environments where accuracy is essential.
Reducing data entry errors is important because reliable data underpins every digital system. If the data is wrong from the start, any process or analysis that relies on it will also be unreliable. For example, a misspelled email address can prevent a customer receiving an order confirmation; an incorrect stock number can cause shortages; and errors in medical or financial systems can have serious consequences. Preventing these errors saves time, lowers costs, improves efficiency, and increases trust in the organisation’s data.
To help avoid these mistakes, digital systems use several methods to reduce human error during data entry. These methods provide structure, checks and support for the user, guiding them to enter accurate, complete and appropriate information.
Validation of User Input
Validation is the process of checking data before it is accepted by the system. The system tests whether the input meets specific rules—such as being in the correct format, within a certain range, or containing the right type of characters.
How it works:
When a user enters information, validation rules check it against criteria. If the input does not match, the system gives an error message and asks the user to correct it.
Examples of validation rules:
Format check: A postcode must follow a valid UK format (e.g., ME4 6AB).
Range check: Age must be between 0 and 120.
Presence check: A required field must not be left blank.
Length check: A phone number must have the correct number of digits.
Data type check: A price must be a number, not text.
Why it reduces errors:
Validation stops incorrect or inappropriate data before it enters the system. It forces users to correct mistakes immediately, which prevents inaccurate data being stored and used later.
"Stop the Garbage"
Scenario: You have been hired by a local gardening group to update their database to include validation to remove inaccurate data entries. This is important to them as, without valid information going into the system, they cannot guarantee the correct information being generated.
Steps:
Using the provided Database file below, add the following validation rules
1. Automatically capitalise an expert's surname
2. A rose height can only be between 0.6 and 1.82
Verification by double entry is a method where the system requires the user to enter the same piece of data twice to confirm accuracy. The system automatically checks whether both entries match.
How it works:
When signing up for an account, a user may need to re-enter their email or password. If the two entries are different, the system highlights the mismatch.
Example:
Typing an email address in two separate boxes—if one is mistyped (e.g., “.co.uk” vs “.couk”), the system detects the difference.
Why it reduces errors:
Double entry verification is especially useful for critical fields where even a small error could cause major issues—such as email addresses, bank account numbers, or passwords. It forces the user to spot and correct errors through repetition.
Drop-Down Menus (Selection Lists)
Drop-down menus allow users to select data from a predefined list instead of typing. This method eliminates typing errors and ensures consistent formatting.
How it works:
Instead of typing a location, job role, or product category, the user clicks a menu and selects from available options.
Examples:
Selecting a department name from a list: “IT Support”, “HR”, “Finance”.
Choosing a delivery method: “Standard”, “Next Day”, “Click & Collect”.
Selecting a country or title from a controlled set of values.
Why it reduces errors:
Drop-down menus:
Prevent spelling errors (e.g., “Maidstone” vs “Madistone”).
Ensure consistency—everyone uses the same wording.
Reduce confusion by showing only valid options.
Speed up data entry.
They are especially useful in systems where categorisation and consistency are important-like stock systems or HR databases.
Pre-Filled Data Entry Boxes (Auto-Fill / Default Values)
Pre-filled boxes contain information provided by the system automatically-either based on previous records, user accounts, or common default settings. The user only needs to confirm or adjust the information.
How it works:
When filling in a form, fields such as name, date, department, or location may already be completed based on stored profile data or the most common choice.
Examples:
A customer’s address auto-fills after entering their postcode.
“Today's date” automatically appears on a report form.
A device serial number is pre-filled for internal IT support requests.
Default values such as “United Kingdom” or “Quantity: 1”.
Why it reduces errors:
Pre-filled information:
Minimises the amount of typing required.
Ensures frequently used data is always correct.
Prevents users from entering invalid or inconsistent information.
Speeds up the overall process.
This method is especially helpful when users repeat similar tasks or when the system already holds reliable background data.
This activity is designed to help you practise reducing data entry errors using common techniques found in real digital systems. You will work with a spreadsheet that includes validation rules, double-entry verification, drop-down menus and pre-filled fields. These features are used in workplaces such as IT support, HR, finance, retail systems and online forms.
By completing the form correctly, you will learn how each method helps prevent mistakes, improves accuracy and makes data more reliable. You’ll also reflect on which types of errors you personally found easier or harder to avoid, helping you understand the importance of entering accurate data in any digital role.
The aim is to give you hands-on experience with the same tools professionals rely on every day to ensure data is correct, consistent and fit for purpose. Download file Download file
3.8.6 Know and understand the factors that impact implementation of data entry:
Time needed to create the screens
The amount of time required to design and build data-entry screens directly affects how quickly the organisation can implement the process.
If screens are complex, contain many validation rules, or need to be accessible on different devices, the development time increases. Longer development time can delay the rollout of the system and slow down the wider project. In T-Level examples, changes to digital systems often require careful planning and adaptation time, which impacts how quickly solutions can be deployed .
Efficient screen creation is important because delays can reduce productivity and increase costs before the new process is even used.
Expertise needed to create screens
The skills required to build data-entry screens also influence implementation.
Screen creation may require knowledge of UX design, database structure, validation rules, and possibly programming or form-building tools. If the organisation does not have staff with the right expertise, the process slows down or becomes more expensive because training or external support is needed.
This mirrors exam content where learners must consider how technical skills and staff capability affect the successful adoption of digital systems and processes .
A lack of expertise can also result in poorly designed interfaces, which increases user errors and reduces efficiency.
Time needed to enter the data.
The amount of time required for staff to input data affects day-to-day productivity.
If forms contain too many fields, require manual typing, or load slowly, the time to enter each record increases. This can reduce staff efficiency and can increase the likelihood of errors because users may rush or become fatigued — consistent with how the mark schemes explain links between user actions, accuracy, and the need for error-prevention methods (validation, verification, drop-downs, pre-filled fields) .
Reducing input time through better screen design, automation or pre-filled fields can therefore improve accuracy and speed.
Explain two factors that impact the implementation of data entry screens within a digital system. Your answer should refer to:
- time needed to create the screens
- expertise needed to create the screens - time needed to enter the data
(4 marks)
Improving Data Entry Efficiency
Scenario:
You have been asked by a digital support technician to evaluate the data entry process used in a small organisation. The current process uses slow, manually typed forms that were built several years ago by staff with limited design experience.
Your Task:
A. Evaluation Task (10 minutes)
Review the three factors below:
Time needed to create the screens
Expertise needed to create the screens
Time needed to enter the data
For each factor, write:
What the issue is in the scenario
How this issue affects staff, accuracy, or efficiency
One improvement you would suggest (e.g., validation, simpler layout, automation, drop-downs)
B. Quick Reflection (5–10 minutes)
Answer the following:
Which factor has the biggest impact on data quality in the scenario, and why?
Which factor could be fixed most quickly?
Which factor needs long-term planning?
3.8.7 Understand the relationship between factors that impact data entry and data quality and make judgements about the suitability of methods to reduce data entry errors in digital support and security.
High-quality data underpins secure, reliable and compliant digital-support operations. The accuracy of data entered into a system directly affects its usefulness for troubleshooting, monitoring, reporting, cyber-security processes, and compliance with legal requirements such as GDPR. Several factors influence the effectiveness and accuracy of data entry, and these have a direct relationship with the quality of the resulting dataset.
1. Time Required to Enter Data - Impacts Accuracy and Completeness
When data entry is rushed (e.g., technicians under time pressure logging incidents during busy shifts), errors become more frequent. These may include:
Transposition errors – swapping of characters (seen in Paper 1 Q2b: Transposition )
Omitted or incomplete fields
Lower time investment → Higher error probability → Reduced quality.
2. Expertise and Skill Level of the User - Impacts Validity and Consistency
Users with low digital literacy may misinterpret prompts, choose incorrect items from dropdown menus, or misunderstand technical terminology.
This leads to:
Invalid data types
Incorrect categorical selections
Misformatted entries (dates, IP addresses, device names)
The mark scheme in Paper 1 (Question 2c) highlights how validation and verification methods exist specifically to mitigate errors from user inaccuracy or misunderstanding.
3. Complexity of the Data Entry Screens - Impacts Usability and Error Rates
Screens that are cluttered, poorly labelled or require multi-stage navigation increase the cognitive load on the user, leading to more errors.
Complex screens may:
Confuse users
Encourage guess-work
Slow down workflows
Increase the likelihood of wrong selections in drop-down boxes
4. Environmental and Organisational Factors - Impacts Reliability
In digital support and security, data entry often happens during:
Incident response
Customer interaction
Fault logging and system monitoring
If technicians work in stressful or noisy environments, quality falls due to distraction and pressure.
Judgement: Suitability of Methods to Reduce Data Entry Errors
The Pearson mark schemes expect reasoning that includes a method + linked justification (e.g., Paper 1, Q2c and Paper 2 Q3). The following assessment applies this structure.
1. Validation (Highly Suitable)
Why: Ensures data follows the correct rules (e.g., integers only, valid date format). Impact on quality: Prevents incorrect data types, ensuring datasets remain usable for analytics, monitoring and security auditing. Suitability:Very suitable – works reliably for structured, predictable data.
2. Verification by Double Entry (Moderately Suitable)
Why: Requires the user to type the same value twice, checking for mismatch. Impact: Reduces typographical errors but doubles input time. Suitability:Suitable for critical fields (e.g., device IDs, account usernames) but unsuitable for large volumes of data due to time burden.
3. Drop-Down Menus (Highly Suitable)
Why: Limits choices to valid options, making many errors impossible. Impact: Improves consistency and eliminates spelling/format errors. Suitability:Very suitable, especially for categorised or structured data (incident type, device model, location).
4. Pre-Filled Boxes / Auto-Completion (Suitable in Repetitive Contexts)
Why: Reduces typing and speeds up workflows where common answers dominate. Impact: Minimises human error but may introduce “confirmation bias” if users accept default values incorrectly. Suitability:Good, but requires careful design to avoid complacency.
5. User Training (Essential but Variable)
Why: Improves understanding of data requirements and system UX. Impact: Raises overall accuracy but is dependent on user motivation and retention. Suitability:Essential baseline measure, though not error-proof.
Why: Reduces cognitive load, guiding users toward correct behaviour. Impact: Can significantly reduce error rates and increase speed. Suitability:Very suitable, especially when combined with validation.
Case Study: Data Quality Risks in a Security Support Environment
Context:
A Digital Support Technician at "SecurePoint IT Services" logs all security-related incidents into a centralised security ticketing platform. The organisation has recently experienced rising error rates in incident logs, such as:
Incorrect device IDs
Wrong IP addresses
Incorrect categorisation of threat types
Missing timestamps
Events:
A technician rushes through logging suspicious traffic alerts during a DDoS mitigation event.
Time pressure leads to an incorrect IP range being entered.
As a result, the security team blocks the wrong subnet, disrupting internal VoIP traffic.
Less-experienced staff misinterpret the "Threat Vector" dropdown and repeatedly select unrelated categories.
The security analytics dashboard becomes unreliable.
Weekly reports misrepresent the type of attacks being faced.
Complex multi-screen navigation causes technicians to skip mandatory fields.
Incident logs are incomplete, limiting root-cause analysis.
Solutions Implemented:
Dropdown menus for threat types and device categories.
Validation rules enforcing correct IP formats.
Revised screen layout with clearer grouping and progressive disclosure.
Short, targeted refresher training.
Reasonable time allocations for post-incident logging.
Outcome:
Error frequency drops by 62%. Incident analysis becomes more reliable, and the SOC (Security Operations Centre) prevents two near-miss escalation events caused by earlier poor-quality data.
“How Data Entry Factors Influence Data Quality in Digital Support & Security”
Activity:
Students work in pairs to produce a 5–7 minute presentation explaining the relationship between data entry factors and data quality, including a justified evaluation of methods used to reduce data entry errors.
Areas You Must Cover (Mirrors Exam Expectations)
Explanation of factors affecting data entry:
- Time
- User expertise
- Screen/interface complexity
- Environmental influences
Analysis of how these factors affect data quality:
- Accuracy
- Validity
- Completeness
- Consistency
- Reliability
Judgement of methods to reduce data entry errors:
- Validation
- Verification
- Drop-down menus
- Pre-filled/auto-complete
- UX design
- Training
Use linked justifications
Reflecting the “one mark for explanation + one mark for justification” style in Pearson papers (e.g., Paper 1 Question 2c).
Apply content to a realistic digital support/security scenario
e.g., SOC incident logging, IT helpdesk ticketing, compliance reporting.
Final judgement/conclusion
- Which methods are most effective?
- How do they improve data quality in a security-focused environment?
Success Criteria (Teacher-Facing but Student-Friendly)
- Clear explanation of relationships between factors and data quality
- Accurate use of terminology (validation, verification, accuracy, reliability, transposition etc.)
- Evidence-based evaluation
- Realistic security-linked examples
- Professional, structured presentation delivery
3.8.8 Understand the relationship between factors that impact implementation of data entry and make judgements about the suitability of implementing data entry in digital support and security.
Files that support this week
English:
Assessment:
Learning Outcomes:
Awarding Organisation Criteria:
Maths:
Stretch and Challenge:
E&D / BV
Homework / Extension:
ILT
→
→
→
→
→
→
Week 9
T&L Activities:
3.9 Data visualisation
3.9.1 Know and understand data visualisation formats and when they are used:
Data visualisation formats are used whenever organisations need to transform raw, often complex, data into something that people can quickly understand and act upon. In IT and digital-support settings, staff regularly monitor performance dashboards, network activity logs, help-desk metrics, security alerts, and customer-service statistics. Without visualisation, this information would be harder to interpret, meaning issues could be missed or decisions could be delayed. Visual formats such as charts, graphs, maps, dashboards, or infographics help highlight patterns, compare categories, show changes over time, and reveal anomalies that might indicate risks or opportunities. Good visualisation reduces cognitive load, increases clarity, and supports better communication between technical and non-technical audiences.
Graphs
Charts
Tables
Reports
Dashboards
Dashboards in digital support and cyber security are centralised interfaces that display live or near-real-time information using charts, graphs, alerts, and status indicators. They take data from monitoring tools, logs, help-desk systems, and network devices and present it in a clear visual format so that support teams can make quick decisions.
Dashboards are used because digital environments generate huge amounts of data network traffic, CPU usage, login attempts, patch updates, ticket workloads, security alerts, and more. Without dashboards, this data would be difficult to read and patterns might be missed. A well-designed dashboard helps technicians identify problems faster, monitor the health of systems, detect anomalies, and report information clearly to both technical and non-technical stakeholders.
Examples of dashboards might include
Network Monitoring Dashboard
Used for: Tracking the health and performance of network devices.
Typical visuals:
Line graphs showing bandwidth usage
Alerts for high latency or packet loss
Device status (up/down)
Heat maps showing Wi-Fi signal strength
Why it’s useful:
Helps digital support teams quickly spot bottlenecks, outages, or unusual spikes in traffic (which may indicate DoS attacks).
Infographics are visual communication tools that combine images, icons, diagrams, and short text to present technical information in a way that is simple and easy for a wide audience to understand. They are especially useful in digital support and security because many stakeholders—such as staff, customers, senior management, or non-technical users may not understand complex terminology or data from logs, reports, or monitoring tools. Infographics translate these complex ideas into visually engaging summaries, helping people quickly understand risks, trends, instructions, or best practices.
In organisations, infographics are used to raise awareness, educate users, and support safe digital behaviour. They are also used by technical teams to communicate findings, report security incidents, or summarise guidance from frameworks such as Cyber Essentials, GDPR, or internal network policies.
“Choose the Best Visualisation”
Scenario
You have joined the Digital Support team for a medium-sized organisation. Your line manager has given you four sets of data that need to be presented to different stakeholders (technical and non-technical). Your job is to choose the most suitable data visualisation format for each dataset and justify your choice.
Instructions ;
1. Read each dataset description below. 2. Choose ONE visualisation format from the list (charts, tables, reports, dashboard, infographic). 3. Explain in 2–3 sentences why your chosen format is the best tool for that dataset. 4. Share your answers with someone next to you and compare your choices.
5. Be prepared to explain your decision to the class.
Dataset A – Support Tickets
You have weekly data showing how many support tickets were raised in five different departments. Task: Which visualisation format best shows comparisons between departments?
Dataset B – Network Traffic
You have minute-by-minute network usage data collected over 24 hours. Task: Which visualisation shows fluctuations and patterns over time?
Dataset C – Log-In Failures
You have a table showing the number of failed log-ins per hour across different rooms in the building. Task: Which visualisation helps identify patterns or hotspot areas?
Dataset D – Cyber-Attack Locations
You have locations of attempted cyber-attacks from around the world over the last month. Task: Which visualisation helps show data by region or country?
3.9.2 Know and understand the benefits and drawbacks of data visualisation formats based on:
Data visualisation formats such as charts, graphs, dashboards, network diagrams, and infographics are vital tools for turning raw data into meaningful information. They allow patterns, trends, risks, and relationships to be understood at a glance. This is especially important in digital support and security, where teams monitor system metrics, identify incidents, and communicate technical information to stakeholders.
However, even though visualisation can make data clearer, it also brings limitations and potential risks. Poorly chosen visual formats can mislead users, oversimplify complex issues, or hide important details. In security settings, a misunderstanding caused by a flawed visualisation may lead to incorrect decisions, delayed incident response, or miscommunication between technical and non-technical staff. Let's look at some of these areas below.
Type of data
This relates to what information is being visualised and how suitable each format is for that data.
Benefits
Different visual formats are ideal for specific data types:
Line graphs → excellent for time-series data (e.g., bandwidth over 24 hours).
Bar charts → ideal for categorical data (e.g., number of support tickets per department).
Heat maps → effective for frequency/volume intensity data (e.g., hotspots of failed logins).
Scatter plots → good for correlation data (e.g., CPU load vs. temperature on a server).
Drawbacks
Choosing the wrong visualisation makes the data harder to interpret.
A pie chart does not work for time-series security events.
A line graph is misleading for purely categorical data.
Some data types (e.g. logs, raw IP-based attacks) may require context that visuals alone cannot show.
Example
A technician tries to show DDoS attack frequency with a pie chart—this misrepresents the data because the attack occurs over time, not as categories.
Intended audience
This refers to who the visualisation is designed for and how their level of digital understanding affects its effectiveness.
Benefits
Visualisations make technical information accessible for non-technical audiences:
Infographics can explain phishing risks to general staff.
Executive dashboards simplify metrics for senior managers.
Technical audiences benefit from more detailed visuals:
Security analysts use SIEM dashboards with multiple graphs, raw events, and filters.
Drawbacks
Oversimplified visuals can hide critical detail from technical staff.
Highly technical dashboards can overwhelm non-technical users.
Visual choices must match the user’s skill level to avoid misunderstanding.
Example
A colourful infographic summarising malware alerts works great for general staff training, but a SOC analyst needs the raw logs, timestamps, and attack vectors—not just a simplified visual.
Brief.
This refers to why the visualisation is being created—its goal, the message it must convey, or the decision it must support.
Benefits
A well-written brief ensures the most effective format is chosen.
A network status dashboard supports real-time decision-making.
A monthly help-desk performance report supports service improvement.
A cyber-risk infographic supports organisational awareness.
Drawbacks
A vague or unclear brief leads to poor visual design choices.
If the brief doesn’t specify audience, data type, or required outcome, visuals may be:
too detailed
too simplistic
or incorrectly focused
Example
If the brief is “show the security posture of the organisation,” a single chart is insufficient; a multi-component dashboard showing device compliance, patch levels, endpoint alerts, and login anomalies would be needed.
Files that support this week
English:
Assessment:
Learning Outcomes:
Awarding Organisation Criteria:
Maths:
Stretch and Challenge:
E&D / BV
Homework / Extension:
ILT
→
→
→
→
→
→
Week 10
T&L Activities:
3.10 Data models
3.10.1 Know the types of data models and understand how they organise data into structures:
Data models describe how data is structured, stored, related, and accessed within a system. They act as blueprints that define how information flows, how tables or objects connect, and how systems interpret and manage data.
In Digital Support and Security, data models are essential because technicians rely on structured information to manage devices, users, logs, permissions, and security events. The better the data is organised, the easier it is to maintain system integrity, detect incidents, troubleshoot faults, and ensure compliance with policies like GDPR or access-control rules.
Below are the main data models used in modern IT support and security environments, with explanations, structures, and industry-linked examples.
Hierarchical
This model organises data in a tree-like structure, with parent–child relationships.
How it Organises Data
Each child has one parent.
Data flows in a single direction.
Works well for data that naturally forms a hierarchy.
Digital Support & Security Example
Active Directory (AD) uses a hierarchical model:
Organisation → Domains → Organisational Units → Users/Devices
This makes it easy to apply security policies (GPOs), permissions, and access-control rules at different levels.
Strengths
Clear structure
Fast traversal
Ideal for logical grouping
Weaknesses
Not flexible
Hard to represent many-to-many relationships
Network
A flexible model where entities can have multiple parents and form complex interconnected graphs.
How it Organises Data
Uses nodes and set relationships
Supports many-to-many links
More flexible than the hierarchical model
Digital Support & Security Example
Modelling complex network topologies:
Devices connected to multiple switches
Firewalls linking multiple VLANs
Virtualised networks (SDN) with many connections
This helps technicians map out:
data flow paths
potential attack routes
dependency chains during troubleshooting
Strengths
Very flexible
Good for real-world networks
Weaknesses
Harder to design than relational models
Relational.
The most common model. It organises data into tables with rows and columns, linked by keys.
Security technicians use relational models to track:
failed logins
antivirus events
firewall logs
patch statuses
Strengths
Highly structured
Supports ACID compliance
Great for incident reporting
Weaknesses
Less effective for large unstructured security data
Requires normalisation and maintenance
“Choose and Justify the Data Model”
Duration: 20–30 minutes Format: Individual or small group Skills Developed:
- Understanding data models
- Applying theory to digital support & security contexts
- Justification and reasoning
- Technical communication
Scenario Overview
You have joined the Digital Support & Security team for a medium-sized organisation. Your manager wants to redesign several data systems to improve performance, security monitoring, and efficiency.
Each system uses a different type of data, and your job is to choose the most appropriate data model and justify your reasoning.
You must read each scenario, decide which data model fits best, and explain: 1. Why that model fits the system’s data and purpose
2. How it supports digital support or security tasks
3. What could go wrong if the wrong model is chosen
Use the data models below:
- Hierarchical
- Relational
- Network
-
Task Sections
Task A – Identify the Correct Data Model
Read each scenario and choose one data model.
Scenario 1 – Help Desk Ticketing System
The organisation wants a system to record:
- user details
- ticket categories
- timestamps
- ticket status (open/closed)
- technician assignment
The system must be able to run reports such as “tickets per department” and “average resolution time”.
Question:
What data model should this system use? Why?
Scenario 2 – Network Topology Mapping
You are building a tool that shows:
- switches linked to multiple devices
- firewalls with multiple inbound/outbound routes
- VLANs connected to different departments
- multiple links between nodes
Question:
Which data model can best represent these complex many-to-many connections?
Scenario 3 – SIEM Security Log Storage
Each security event generates information in JSON format, including:
- timestamp
- event type
- username
- IP address
- device
- geo-location
- risk score
Log volume is very high and changes every second.
Question:
Which data model can handle large volumes of semi-structured security log data?
Scenario 4 – Authentication Cache
Your system needs to store temporary information such as:
- active user sessions
- failed login counters
- account lockout timers
- IP-blacklist entries
These need to be retrieved very quickly.
Question:
Which data model is designed for fast lookups?
Scenario 5 – Cyber Attack Path Analysis
Security analysts want to visualise relationships between:
- users
- devices
- IP addresses
- events
- privileges
- lateral movement paths
They need to follow connections to find how a potential attacker could move inside the network. Question:
Which data model is best for mapping connected relationships?
Scenario 6 – Company Directory (Active Directory Style)
You must store:
- organisation
- departments
- sub-groups
- users
- devices
Access policies need to be applied to whole branches (e.g., “all students”, “all admin staff”).
Question:
Which model fits a parent→child structure?
What is a SIEM?
Task B – Short Justification Table
Fill in a table like this:
You must explain:
- why your choice fits the data
- how it supports digital support/security
- what limitations it might have
Task C – Reflection
Write a short paragraph answering: Why is it important to choose the correct data model in Digital Support & Security environments?
Think about:
- data integrity
- security monitoring
- response times
- system performance
- compliance (e.g., GDPR)
Task D (Optional Extension)
Design a simple visual diagram of any two of your chosen models, showing how the data is structured.
Examples:
- Hierarchical tree (like Active Directory)
- Relational tables with keys
- Graph of users → devices → IPs
- JSON document example for a SIEM event
3.10.2 Know and understand the factors that impact the selection of data model for organising data:
• efficiency of accessing individual items of data
• efficiency of data storage
• level of complexity in implementation.
3.10.3 Understand the benefits and drawbacks of different data models and make judgements about the suitability of data models based on efficiency and complexity.
Exam Preparation
1. State one benefit of using a hierarchical data model to organise data.
(1 mark)
2. State one drawback of using a hierarchical data model to organise data.
(1 mark)
3. Explain one benefit of using a network data model for complex organisational data.
(2 marks)
4. Explain one drawback of using a network data model when supporting modern digital systems.
(2 marks)
5. Relational data models are widely used in digital support services. Explain one reason why relational data models are efficient for accessing individual items of data.
(2 marks)
6. Give one reason why a document-based (NoSQL) data model may be more suitable than a relational model for storing large volumes of unstructured support logs.
(1 mark)
7. Explain one drawback of using a document-based (NoSQL) model for data that requires strict consistency.
(2 marks)
8. A small IT support company stores customer details and tickets in a single large spreadsheet.
They are considering moving to a relational database or a document-based model.
Explain two ways a relational model would improve efficiency compared to the spreadsheet.
(4 marks)
9. A college stores learner records such as attendance, marks, course enrolments and disciplinary actions.
The data needs to be accessed by multiple teams (support, safeguarding, curriculum).
Explain with justification which data model would be most suitable and why.
(6 marks) This should follow the AO2/AO3 style seen in long-form questions in Paper 2.
10. A cybersecurity operations team stores millions of log entries per day from firewalls, servers and IoT devices.
They must query the data quickly during incident response.
Discuss the suitability of using:
- a relational data model
- a wide-column NoSQL model for this purpose.
Your answer should include the benefits, drawbacks and a justified conclusion.
(9 marks) This mirrors the Level-based mark scheme style used in extended questions.
3.10.4 Be able to draw and represent data models:
• hierarchical models with blocks, arrows and labels
• network models with blocks, arrows and labels
• relational models with tables, rows, columns and labels.
Drawing and Representing Data Models
Scenario
You have been asked to help a junior member of the IT Support Team understand how different data models organise and present information.
To support them, you will create three diagrams that show the same small dataset using hierarchical, network, and relational models.
The small dataset is:
Company Departments
IT, HR, Finance
Employees
Each employee belongs to a department
Some employees work on more than one project
Your task is to draw each model in the format suggested. Task Instructions
1. Hierarchical Data Model (Tree Structure)
Goal: Draw a tree using blocks, arrows and labels to show parent, child relationships.
What your diagram must include
“Company” as the root node
Branches for Departments
Each department pointing to its Employees
A simple name label on every block (e.g., “IT Department”, “Employee: Sarah”)
Instructions
Draw a box at the top labelled Company.
Draw three boxes below: IT, HR, Finance.
Draw arrows downward from Company to each Department.
Add at least two employees under each department and link them with arrows.
Make sure all arrows point one way (top -bottom).
Checklist
- One parent per child
- No cross-links between departments
- All entities labelled clearly
2. Network Data Model (Many-to-Many Links)
Goal: Draw a network diagram showing how employees can belong to more than one project.
What your diagram must include
Blocks for Employees
Blocks for Projects
Arrows (or connecting lines) showing links
Clear labels on all blocks
Instructions
Draw three employee blocks (e.g., Sarah, Tom, Aisha).
Draw three project blocks (Cyber Upgrade, Website Redesign, Staff Onboarding).
Connect employees to the projects they work on.
Example: Sarah → Cyber Upgrade and Website Redesign
Tom → Website Redesign
Aisha → Staff Onboarding and Cyber Upgrade
Use arrows or lines to show many-to-many connections.
Checklist
- Employees can link to more than one project
- Projects can link to more than one employee
- No “top node”; it is a web of connections
3. Relational Data Model (Tables, Rows & Columns)
Goal: Create a set of tables that show how data is normalised and linked using keys.
What your diagram must include
A Departments table
An Employees table
A Projects table
A Link/Join table for Employee Project relationships
Column names, primary keys (PK) and foreign keys (FK)
DepartmentID (PK)
DepartmentName
1
IT
2
HR
3
Finance
EmployeeID (PK)
EmployeeName
DepartmentID (FK)
101
Sarah
1
102
Tom
1
103
Aisha
3
ProjectID (PK)
ProjectName
P1
Cyber Upgrade
P2
Website Redesign
P3
Staff Onboarding
EmployeeID (FK)
ProjectID (FK)
101
P1
101
P2
102
P2
103
P1
103
P3
Instructions
Create the following tables as diagrams: Table 1 - Departments
Table 2 - Employees
Draw arrows showing: Employees.DepartmentID → Departments.DepartmentID
Table 3 - Projects
Table 4 - EmployeeProjects (Join Table)
Draw arrows from both FKs to their parent tables.
Checklist
- Each table has a primary key
- Foreign keys link tables
- No repeated groups of data
- Structure supports many-to-many relationships
Extension Challenge (Optional)
Choose one of the three models and answer: “Explain one benefit and one drawback of this model in a real IT Support or Security context.”
Files that support this week
English:
Assessment:
Learning Outcomes:
Awarding Organisation Criteria:
Maths:
Stretch and Challenge:
E&D / BV
Homework / Extension:
ILT
→
→
→
→
→
→
Week 11
T&L Activities:
3.11 Data access across platforms
3.11.1 Understand the features, purposes, benefits and drawbacks of accessing data across platforms:
Accessing data across platforms refers to the ability to retrieve, update, or use data from different devices, systems, operating environments, or applications. Examples include viewing cloud-stored documents on a mobile phone, a laptop, or a browser; accessing databases from Windows and Linux systems; or pulling device logs from IoT hardware into a central dashboard.
This capability is essential in modern digital support and security environments where many systems must integrate, communicate, and share information seamlessly
Permissions
Authorisation
Authorisation is the process of determining what a user, device, application, or service is allowed to do once their identity has been authenticated.
It is a key permission strategy used to control access to data throughout its lifecycle from the moment it is collected, while it is stored, and when it is accessed or used later. Authorisation ensures that individuals and systems only interact with the data they are permitted to, based on organisational policy, legal requirements, and security controls.
Privileges
Privileges refer to the specific actions a user, system, or application is allowed to perform on data once they have been authenticated and authorised.
While permissions define what data can be accessed, privileges define what can be done with that data.Privileges are a critical part of access control and directly impact security, compliance, and operational effectiveness.
Common Privileges
Users or systems may have privileges to: Read - View data but not alter or delete it. Write - Create or modify data. Delete - Remove data from storage. Execute - Run scripts, commands, or applications. Share / Forward - Distribute data to others or external systems. Approve / Authorise Actions - Such as approving a transaction or data change request. Admin-Level Privileges
Creating or deleting user accounts
Changing access rights
Configuring security settings
Managing databases or servers
These are the most sensitive privileges.
Privilege Management Strategies
5.1 Least Privilege Principle
Users are given only the privileges necessary to do their job, no more.
Benefits
- Minimises damage from mistakes
- Reduces insider threat
- Limits the impact of credential theft
5.2 Privilege Auditing and Review
Privileges must be reviewed regularly to ensure they are still appropriate.
Example
- A technician who moves to HR should lose access to server logs immediately.
5.3 Just-in-Time Privileges
Users receive elevated privileges temporarily when needed.
Benefits
- Reduces persistent admin rights
- Protects sensitive systems
- Limits misuse
5.4 Separation of Duties
Critical tasks are split so no single person has full control.
Example
- One user initiates a database change
- Another user approves it
Prevents fraud, abuse, or accidental damage.
Access rights
Access rights describe the specific level of access a user, system, device, or application is granted to data or digital resources.
They define who can access data and what actions they can perform, such as viewing, editing, deleting, or sharing information.Access rights are a core component of access control, working alongside permissions, privileges, authorisation, and authentication to keep data secure and compliant with legal requirements.
Rules
Rules are formal, predefined conditions or instructions that determine how data may be accessed, used, collected, stored, shared, or processed within an organisation.
They ensure that data is handled safely, legally, and consistently. Rules sit alongside permissions, privileges, authorisation, and access rights as part of an organisation’s overall access control framework.
Access mechanisms
Role-based access (RBAC)
Role-Based Access Control (RBAC) is a security model where access to data, systems, or resources is granted based on a person's job role rather than the individual themselves. Users are grouped into roles (e.g., Technician, Manager, HR Officer), and each role has a specific set of permissions and access rights. Users inherit access automatically by being assigned to a role.
Examples of RBAC in Digital Support & Security
IT Technician Role
View system logs
Restart services
Modify device configuration
Cannot access payroll or HR files
HR Officer Role
Access employee personal records
Modify attendance or contracts
Cannot access server logs or firewall settings
Student Role
Read-only access to their timetable
Submit work
No access to staff folders or administrative systems
Database Administrator Role
Full access to database configuration
Cannot access HR data unless specifically permitted
Rule-based access control (RuBAC)
Rule-Based Access Control (RuBAC) is a security model where access to data or resources is determined by a set of system-enforced rules. These rules are often global, automated, and applied consistently across the organisation, regardless of a user’s job role. RuBAC is sometimes used alongside Role-Based Access Control (RBAC), but it differs because access is granted or denied based on specific rules written by administrators, not roles or user permissions.
What RuBAC Is
RuBAC uses predefined rules to allow or deny actions.
These rules can be based on:
“Block access to the database outside business hours.”
“Only allow login from the UK.”
“Deny USB access when connected to the corporate network.”
RuBAC is often found in firewalls, operating systems, cloud platforms and identity management systems.
Application Programming Interfaces (API).
An Application Programming Interface (API) is a structured way for different software applications, systems, or devices to communicate with each other.
It defines a set of rules, endpoints, formats, and permissions that allow one system to request data or perform actions on another system safely and consistently.
APIs are essential in modern digital services, cloud computing, automation, data collection and cybersecurity operations.
What an API Is
An API acts as a bridge between systems.
It allows:
Applications to request data
Systems to send responses
Services to integrate without knowing internal code
Secure access to stored or processed information
Examples:
A weather app uses an API to fetch real-time forecasts.
A college MIS sends data to a reporting dashboard via an API.
A cybersecurity tool retrieves logs from a firewall using an API call.
RuBAC, RBAC and APIs
Time: 20 - 25 minutes Total Marks: 18 marks
Scenario
A college IT department manages access to several systems including:
A cloud-based learning platform
An internal staff database
A cybersecurity monitoring dashboard
A set of APIs used to pull attendance data and push timetable updates
To protect the systems, the organisation uses a combination of: Role-Based Access Control (RBAC)
Rule-Based Access Control (RuBAC)
Application Programming Interfaces (APIs) with secure authentication
You have been asked to review the access control setup and evaluate how it protects the data stored, used, and transmitted across systems.
Questions
1. Give one feature of Rule-Based Access Control (RuBAC).
(1 mark)
2. Give one example of how RBAC might be applied in the college's environment.
(1 mark)
3. State one purpose of using APIs in the college’s digital systems.
(1 mark)
4. The cybersecurity dashboard uses RuBAC to block access during high-risk periods.
Explain one benefit and one drawback of using RuBAC in this situation.
(4 marks)
5. The staff database uses RBAC to restrict editing rights to specific roles.
Explain two ways RBAC supports data confidentiality in this system.
(4 marks)
6. The learning platform uses an API to send attendance data to the college MIS.
Explain two security considerations the IT team must implement to protect API data transfers.
(4 marks)
7. A technician suggests combining RBAC, RuBAC and APIs to create a layered security approach.
Discuss whether this is a suitable approach for the college, using justified points for and against. Provide a supported conclusion.
(3 marks)
(Level-based mark Q - AO2/AO3 style)
3.11.2 Know and understand the benefits and drawbacks of methods to access data across platforms.
3.11.3 Understand the interrelationships between data access requirements and data access methods and make judgements about the suitability of accessing data in digital support and security.
Files that support this week
English:
Assessment:
Learning Outcomes:
Awarding Organisation Criteria:
Maths:
Stretch and Challenge:
E&D / BV
Homework / Extension:
ILT
→
→
→
→
→
→
Week 12
T&L Activities:
3.12 Data analysis tools
3.12.1 Know data analysis tools and understand their purpose and when they are used:
• storing Big Data for analysis:
o data warehouse
o data lake
o data mart
• analysis of data:
o data mining
o reporting
• use of business intelligence gained through analysis:
o financial planning and analysis
o customer relationship management (CRM):
– customer data analytics
– communications.
3.12.2 Understand the interrelationships between data analysis tools and the scale of data
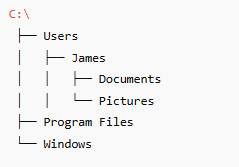 Each folder (child) belongs to one parent, allowing clear paths and logical navigation.