Top
Week 4
1.2 Algorithmic design
1.2.1 The definition and understand the characteristics and purpose of algorithms
1.2.2 The methods to express algorithms:
An algorithm is a set of step-by-step instructions designed to perform a specific task or solve a problem. In computing and digital support, expressing algorithms clearly is essential - it ensures that systems are reliable, efficient, and easy to maintain.
Algorithms can be expressed in multiple ways depending on the audience:
-
Flowcharts - for visual communication and process mapping.
-
Written or structured descriptions - for precise documentation and planning.
Both methods serve different purposes:
-
Flowcharts help you visualise the flow of data and decisions.
-
Written hierarchical descriptions help you describe logic in structured, readable form - often useful in planning pseudocode or communicating with technical teams.
Flowcharts
Flowcharts use symbols and arrows to represent the logical flow of an algorithm. They make it easy to see where inputs enter, decisions are made, and processes occur.
Common Flowchart Symbols
| Symbol | Name | Function |
|---|---|---|
| Terminator | Shows the start or end of the process. Typically labelled Start or End. | |
| Process | A single step or instruction, e.g., Calculate total cost. | |
| Sub-process | Represents a smaller, reusable algorithm called within the main process. | |
| Decision | A question that results in Yes/No or True/False branches. | |
| Input/Output | Represents data being entered or displayed (e.g., Input username or Display result). | |
|
|
Arrow | Shows the flow or direction of the algorithm. |
| [Label] | Label | A text marker or reference point to clarify flow or connect parts of the chart. |
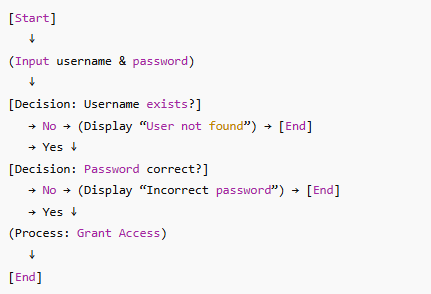
Example Flowchart Login Validation System
Scenario
A college’s student login portal checks user credentials before allowing access.
Flowchart Steps
-
Start
-
Input username and password
-
Check if username exists in the database
-
Decision: If No, display “User not found” > Go to End
-
If Yes, verify password
-
Decision: If password incorrect > display “Incorrect password” > End
-
If correct, grant access
-
End
Flowchart Visual Summary (Text-based)
Case Study: Airport Check-in Kiosk
An automated self-service check-in kiosk uses a flowchart algorithm to manage passengers:
-
It starts when the passenger touches the screen.
-
It inputs passport data.
-
It decides whether the flight is valid for check-in.
-
If yes, it prints a boarding pass.
-
If not, it displays an error message.
By following a flowchart, engineers can debug or enhance the kiosk’s logic quickly.
"Feel the Flow"
You are designing a college printing system.
Create a simple flowchart showing how a student prints a document using the college printer. Include:
A start and end symbol
At least one input/output (e.g. “Upload file”)
One decision (e.g. “Does student have enough credit?”)
One process (e.g. “Send file to printer”)
Arrows to show direction
Extension:
Label your decision outcomes (Yes/No) clearly.
Written Descriptions Using Hierarchical Markers
Some algorithms are best expressed in written structured form - especially when precision or documentation is important.
This format uses hierarchical markers (e.g., numbers and letters) to show sequence and sub-steps.
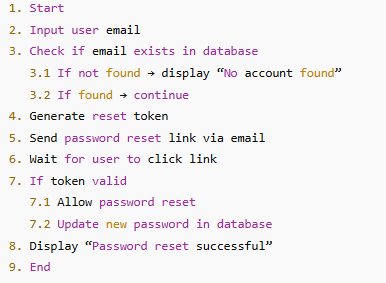
Example: Password Reset Algorithm (Written Description)
Why use this method?
-
Ideal for system documentation or planning code.
-
Helps non-visual learners see the order of logic.
-
Easy to convert into pseudocode or actual programming logic.
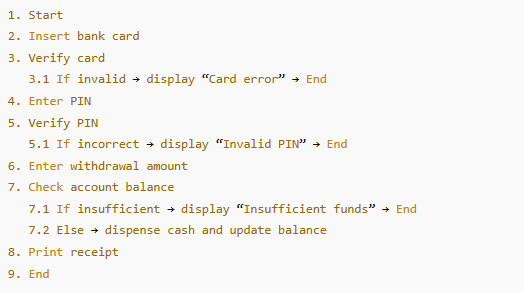
Case Study: Bank ATM Transaction Process
A software developer describes the ATM withdrawal algorithm in hierarchical format:
Write a Hierarchical Algorithm
You have been asked to describe the algorithm for booking a college IT suite using a written hierarchical format.
Your steps should include:
Input of booking details (room, date, time)
Checking for availability
Confirmation message if successful, or error if not
Example start:
1. Start
2. Input room, date, and time
3. Check if available
........
Extension:
Add sub-steps for what happens if the booking is rejected.
1.2.3 The benefits and drawbacks of expressing algorithms in flowcharts.
Flowcharts are a visual method of expressing algorithms using standardised symbols to represent processes, decisions, inputs, and outputs. One of the major benefits of using flowcharts is their ability to make complex algorithms easier to understand and communicate. Visual representations allow programmers, designers, and even non-technical stakeholders to quickly follow the logic of a process step-by-step. This helps in identifying errors or inefficiencies early in the design stage, saving time and resources during implementation. Flowcharts also provide a universal language — standard symbols make them accessible across industries and educational settings. For example, when troubleshooting or documenting legacy systems, a flowchart can offer a quick visual summary of the logic behind a process without requiring extensive code analysis.
However, there are drawbacks to relying heavily on flowcharts for algorithm design. As systems grow in complexity, the flowcharts can become unwieldy and difficult to manage. A small change in logic may require redrawing large portions of the diagram, reducing efficiency. Overly detailed flowcharts can also become confusing, defeating their purpose of simplifying understanding. Furthermore, unlike pseudocode, flowcharts lack flexibility for precise algorithmic notation and cannot easily express concepts like recursion or dynamic structures. In collaborative environments, inconsistencies in symbol use or layout can lead to misinterpretation among team members, particularly if version control is not well managed.
Case Study 1 – Benefit
Organisation: NHS IT Department
Scenario: The department developed an algorithm to manage patient check-in processes at local clinics.
Outcome: By expressing the process in a flowchart, non-technical healthcare managers were able to visualise the logic of patient routing between reception, triage, and consultation. The diagram identified bottlenecks and led to redesigning part of the process to include an automatic queuing system. As a result, waiting times were reduced by 15%, and data entry errors were halved. The flowchart’s clarity allowed both technical and non-technical staff to collaborate effectively.
Case Study 2 – Drawback
Organisation: Fintech start-up developing fraud detection algorithms
Scenario: The development team initially designed all their decision-making processes using large flowcharts.
Outcome: As the algorithms grew to include hundreds of conditions and nested decisions, the flowcharts became so complex that maintaining them was impractical. Different developers misinterpreted some conditions, resulting in inconsistent implementations. Eventually, the company switched to pseudocode and modular diagrams to represent the logic more efficiently. This case highlighted how flowcharts can hinder large-scale development if they are not modularised or properly managed.
Title: Research and Evaluate the Use of Flowcharts in Algorithm Design
Instructions to the Student:
You are working as a junior technician for a software development company. Your team uses flowcharts to map out system processes before programming begins.
1. Research two real-world examples of how flowcharts are used in system or algorithm design (for example, healthcare, logistics, or gaming).
2. For each example, describe:
- What process or algorithm was expressed using a flowchart.
- What benefits or challenges were experienced.
3. Summarise your findings in a short report (200–250 words) explaining whether you think flowcharts are more beneficial or limiting for complex systems.
4. Include one image or diagram from your research if possible.
Mock Exam Question (Based on T-Level DSS Format)
Question 14 (b)
Flowcharts are often used to represent algorithms in digital system design.
Evaluate the suitability of using flowcharts to design a new automated customer booking system for a travel company.
Your answer should consider both benefits and drawbacks of using flowcharts in this context.
(9 marks)
Suggested Mark Scheme (Levels-Based – aligned to Pearson T-Level DSS style)
1-3 Marks: Demonstrates a basic understanding of flowcharts with limited reference to their advantages or disadvantages. Provides simple statements without linking to the context of a booking system. Limited use of terminology or examples.
4-6 Marks: Demonstrates a good understanding of how flowcharts can be used to design systems. Provides relevant advantages and disadvantages, with some application to the travel company scenario. Some justifications are developed but lack full evaluation.
7-9 Marks: Demonstrates a thorough understanding of the suitability of flowcharts for system design. Provides well-balanced evaluation of both benefits (e.g. visual clarity, stakeholder communication) and drawbacks (e.g. complexity, maintenance). Applies reasoning clearly to the booking system scenario and reaches a supported conclusion.
Indicative Content:
Benefits: simple to understand, visual, supports team communication, aids debugging and documentation.
Drawbacks: complex systems become cluttered, time-consuming to edit, less efficient for conditional logic, lacks scalability.
Contextual application: travel booking systems include many branches (e.g. destinations, seat types, availability), making flowcharts useful for high-level overview but poor for detailed rule logic.
1.2.4 The benefits and drawbacks of expressing algorithms in written descriptions.
Written descriptions (such as pseudocode or step-by-step written explanations) are another method of expressing algorithms. One major benefit of using written descriptions is that they provide precise, structured logic that closely resembles programming syntax. This makes them useful for planning before coding and for teaching logical thinking. Written descriptions can also handle complex conditions and iterations more effectively than flowcharts, because textual notation allows programmers to include multiple variables, nested loops, and conditionals without the visual clutter of a diagram. In professional settings, written algorithms are easy to version control, edit, and share using digital tools such as code editors or documentation systems. This supports collaboration among programmers and ensures consistency when converting designs into working code.
However, there are also drawbacks to expressing algorithms purely in written form. Written descriptions can be less accessible to non-technical audiences who might struggle to interpret pseudocode or programming-style logic. Ambiguity can occur if there is no standardised format, meaning two programmers might interpret a description differently. In addition, lengthy written descriptions can make it difficult to quickly visualise the flow or dependencies between steps, which can lead to missed logic errors. For beginners, long sequences of text may be harder to follow than diagrams, reducing their usefulness for early-stage communication or training purposes.
Title: Research and Compare the Use of Written Descriptions in Algorithm Design
Instructions to the Student:
You are a junior systems developer asked to research how written descriptions (including pseudocode or structured English) are used in industry.
1. Research two examples where written descriptions have been used to design or communicate an algorithm (for example, banking systems, logistics routing, robotics, etc.).
2. For each example, describe:
- What process or algorithm was expressed in written form.
- What benefits and challenges were identified.
3. Summarise your findings in a short written report (200–250 words) explaining whether written descriptions are better suited to technical or mixed audiences, and justify your opinion.
4. Include at least one short snippet of pseudocode or written algorithm from your research to support your discussion.
Mock Exam Question (Based on T-Level DSS Format)
Question 13 (b)
Algorithms can be expressed in written descriptions, such as pseudocode or structured English.
Evaluate the suitability of using written descriptions to design an algorithm for an automated stock-management system in a warehouse.
(9 marks)
1-3 Marks: Demonstrates a basic understanding of written descriptions with limited reference to advantages or disadvantages. Provides general statements not applied to the warehouse context. Little or no justification.
4-6 Marks: Demonstrates a good understanding of how written descriptions can be applied to algorithm design. Gives relevant benefits and drawbacks with partial application to the warehouse system. Some explanation or reasoning provided but evaluation may be unbalanced.
7-9 Marks: Demonstrates a thorough understanding and clear evaluation of the suitability of written descriptions. Considers both benefits (clarity, precision, ease of coding) and drawbacks (lack of visual flow, accessibility) in context of the warehouse stock-management system. Provides a balanced and well-supported conclusion.
Indicative Content:
Benefits: precise notation, easily edited, supports collaboration in software teams, can handle complex loops and conditions, suitable for automation design.
Drawbacks: not visually intuitive, difficult for non-technical users, may lack standardisation, prone to misinterpretation if poorly written.
Contextual application: a warehouse stock-management algorithm might involve multiple conditional checks (e.g. item levels, expiry dates, restock triggers). Written descriptions are ideal for programmers but might not clearly show process flow to warehouse managers or stakeholders.
1.2.5 The actions to control ordering of steps in algorithms:
Algorithms rely on logical structures to control the order in which actions occur. This ensures that computers follow clear, predictable patterns to produce correct results. There are three main control structures used in algorithm design: sequence, selection, and iteration.
Sequence
A sequence is a set of steps executed in a fixed order. Each instruction happens one after another, without skipping or repeating. For example, a printer queue follows a sequential process: receive document → check ink → print → eject paper. In algorithmic terms, sequence represents the simplest form of control, ensuring consistency and predictability. However, sequence alone cannot handle decisions or repetition, so it’s usually combined with selection and iteration.
Selection
Selection introduces decision-making into an algorithm. It allows a program to choose between different paths based on a condition — often expressed as “IF… THEN… ELSE.” For example, a login system checks whether a password matches a stored value. If it matches, access is granted; if not, access is denied. Selection makes algorithms flexible, allowing different outcomes based on input or state.
Iteration
Iteration is repetition — repeating a set of instructions until a condition is met. It’s used when tasks need to happen multiple times, such as checking each item in a list or monitoring sensor data. Loops like “FOR,” “WHILE,” or “DO UNTIL” are common examples. Iteration saves time and reduces errors by automating repetitive actions rather than writing them out multiple times.
Together, sequence, selection, and iteration form the foundation of all algorithmic logic. Every computer program, from a simple calculator to an operating system, uses these three structures to control the flow of operations and make decisions dynamically.
“Algorithm Walkabout”
Time: 10 minutes Type: Active individual task with discussion
Your challenge
You’re going to get up, move around the room, and explore how the three main control structures — Sequence, Selection, and Iteration — appear in real-life situations and digital systems.
Each of you will think of examples, share them with others, and explain your reasoning.
Step 1 – Think of your example (2 minutes)
You’ll be given a sticky note or small card.
On it, write one example of a situation that uses sequence, selection, or iteration.
Try to think of something from real life or from technology.
Here are some ideas to help you:
Sequence: following a recipe, installing an app, starting a computer.
Selection: deciding if a password is correct, approving a payment.
Iteration: scanning multiple files for viruses, looping through playlist songs.
Step 2 – Walkabout and post your example (4 minutes)
Around the room you’ll see three posters labelled:
- Sequence
- Selection
- Iteration
1. Decide which control structure your example fits best.
2. Walk over and stick your note in that area.
3. While moving around, read at least two other examples from other students.
4. Speak to at least one classmate and discuss why their example fits that structure — you can ask questions or challenge their reasoning.
Step 3 – Share and explain (4 minutes)
Your teacher will pick a few examples from each section of the room.
If yours is chosen, be ready to explain why you placed it there.
You might be asked:
- Why does your example show sequence, selection, or iteration?
- What would happen if you changed the order or missed a step?
- Listen to others’ explanations and think about whether you agree or disagree — be prepared to explain your opinion.
What you should understand by the end
By the time you finish this walkabout, you should be able to:
- Identify sequence, selection, and iteration in real or digital systems.
- Explain how each structure controls the order of steps in an algorithm.
- Discuss your ideas clearly with other people and justify your reasoning.
1.2.6 How to determine the purpose of an algorithm and how it works.
“Be the Algorithm Detective – Present Your Findings”
Topic: How to determine the purpose of an algorithm and how it works
Duration: 25–30 minutes
Format: Individual or pairs → short presentation (3 slides + talk)
Your Mission
You are an Algorithm Detective.
Your goal is to examine one example algorithm, work out what it is designed to do and how it achieves that goal, and then present your analysis to the class.
Step 1 – Choose or Receive an Algorithm (3 min)
Your teacher will give you or your group a small algorithm sample (pseudocode or flowchart).
Examples might include:
Calculating an average mark
Determining whether a number is even or odd
Validating a password
Counting login attempts
Step 2 – Investigate (10 min)
On paper or in notes, answer these questions:
Inputs and Outputs –
What information goes in? What comes out?
Purpose –
What is the overall goal of this algorithm?
(Summarise it in one sentence.)
Process –
Describe the steps it takes.
Identify where it uses sequence, selection, or iteration.
Evidence –
Run through an example with your own sample data to prove it works.
Step 3 – Create a Mini-Presentation (10 min)
Build a 3-slide presentation titled “Algorithm Detective Report.”
Slide 1 – The Algorithm
Show or restate your algorithm example.
Label the inputs and outputs.
Slide 2 – Purpose and How It Works
Explain what the algorithm is designed to do and summarise the main steps in plain English.
Highlight any sequence, selection, or iteration.
Slide 3 – Reflection & Improvements
Explain:
What clues helped you determine its purpose?
What did you learn about how algorithms are structured?
Could this algorithm be improved or written differently?
Tip: Keep text short and visual. Use shapes, arrows, or short pseudocode blocks.
Step 4 – Share and Discuss (5–10 min)
Each group (or a few volunteers) presents their slides to the class.
As you listen to others, note:
Did they identify the same or different purpose?
Did they explain how it works clearly?
What patterns appear across all algorithms?
After all presentations, join a short class discussion led by your teacher about how to recognise an algorithm’s purpose and process.
Last Updated
2025-10-14 12:42:35
English and Maths
English
Maths
Stretch and Challenge
Stretch and Challenge
Homework
Homework
Equality and Diversity Calendar
How to's
How to's Coverage
Links to Learning Outcomes |
Links to Assessment Criteria |
|
|---|---|---|
Files that support this week
→
Next ←
Prev