Top
Week 6
Documentation:
When creating documentation towards, or, for a system, there are no specifics or rules to how to approach the documenting of the creation or design of the system. However, it is agreed that planning and documentation is a key requirement.
Design eg picture boards, rich picture diagrams, flowcharts, structured charts;
There are a number of design resources that can be used, these are;
- Picture boards
- Rich Picture diagrams
- Flowcharts,
- Structure Charts
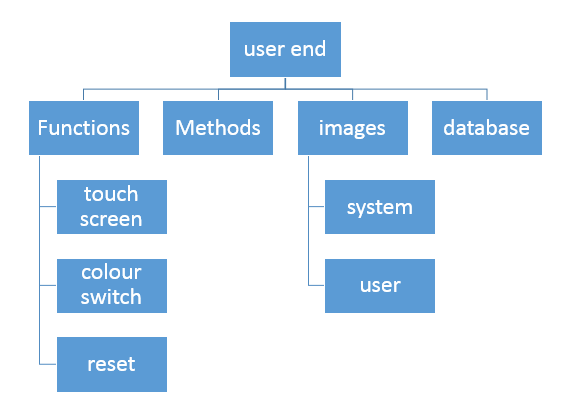
Structure Charts
These are hierarchal documents that are used to display components of a system to a detailed level. For example, within a computer program, a range of operators, functions and methods that may be segmented.
Low Fidelity Prototyping
This type of prototyping use media that is not like the final output, for example, this could be the use of paper and or cardboard to give a sense of structure.
The benefit of using low fidelity prototyping is that it is quick, cheap and easily changed. Classic examples of this are the use of sketches of screens in a sequence that a user would follow.
High Fidelity Prototyping
This type of prototyping is linked closer to the final product output media and enables a potential experience of the final system. These prototypes can be built in environments like Visual Basic .Net and Powerpoint
The Aims of prototyping in software
The aim and purpose of prototyping in software is to target areas that may make a system clunky and usable for users to use and understand. This look and feel effect that a prototype can provide can provide developers further insights to the functional inputs and outputs against user requirements.
Narrative eg original specification, description of how result achieved;
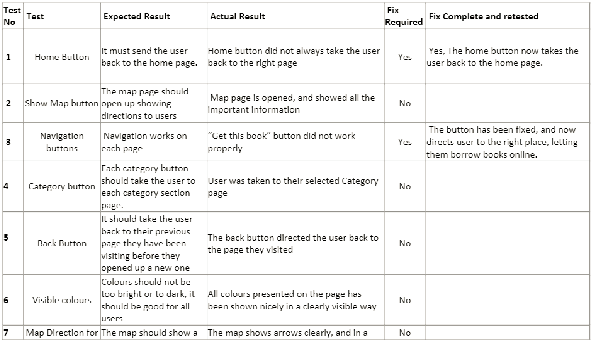
Test log
Possibly the most vital parts of any systems design is the testing stage. Testing the design of a purposed prototype is an opportunity to perfect and hone a prototype to meet its intended purpose and function. It is important to log all of the stages and tests undertaken, this includes the following areas.
- When it was tested
- What was tested
- How it was tested
- Where it was tested
- Who tested it
Any testing should be against the original specification and design requirements that the client had. This will enable testers to assess the impact of the tests against the product and offer suggestions against how that thing can be updated or improved.
Last Updated
2018-04-16 13:27:00
English and Maths
English
Qualitative - Opinion, verbal and written viewpoints.
Maths
Quantitative- Number and numerical data capture
Stretch and Challenge
Stretch and Challenge
Homework
Homework
Equality and Diversity Calendar
How to's
How to's Coverage
Learning Capture - Teachers allocate time at the end of the session for the group to write down what they think they have learned. The information shared helps the teacher to see which content he may need to revisit and so shapes future planning.
Anonymous Assessment - Learners assess an anonymous piece of work containing deliberate mistakes against given success criteria.
Links to Learning Outcomes |
Links to Assessment Criteria |
|
|---|---|---|
LO3 Be able to design and implement user interfaces |
P5 test the HCIs created M3 explain how the effectiveness of HCIs may be measured. P6 document the HCIs created. D2 evaluate the HCIs developed. |
Files that support this week
→
Next ←
Prev