week 5
Learning Aims and Objectives:
Aim: In this week's page, students will learn the.
Objectives:
1. By the end of this week's page students will be able to.
2. By the end of the week's page students will be able to.
3. By the end of the week's page students will be able to .
4. By the end of the week's page students will be able to
5. By the end of the week's page students will be able to.
B2 Design documentation
The features and characteristics of relational database design techniques and their application to
solve problems:
• requirements of the brief (audience, purpose and client’s requirements)
When creating a database solution, it is essential to completely understand the requiremetns of the client and the purpose of the required database. This should be where you read back to the client you understanding of thier problem and the intended solution to this. Once you and the cleint are in agreement to the issues, requirement, and solution then the development SHOULD be smoother.
Security and legal considerations:
When creating the solution, key legislation and legal elements must be completely clear and understood as neglecting these may lead to legal fines or imprisonment, such laws to reflect on are,
o Data Protection Act 1998 : -
Go to the link below and review the legislation and its principal parts, identify how many principles that there are;
Government Website on DPA Act 1998
o The European Union (EU) Directive on Data Protection (legislation must be current and applicable to England, Wales, Northern Ireland)
Within Europe, there are a number of principles that as a "current member (30/09/2019) the UK must obey. The legislation can be linked can be found in the link inside the activity.
Review and research the legislation that is enforceable within the EU for Data protection.
EU Legislation
• data structure designs:
Data structure designs are a useful tool for the ability to understand the problems solution and the intended approach to the implementation of the solution.
o data dictionaries and their use: tables, field attributes, validation
As discussed in the previous weeks areas, data dictionaries enable the developer to outline and follow the correct structure and field formats and any validation rules or attributes associated with a field area, for example, the telephone number, most automatically choose the number as its a telephone "NUMBER" however in a database the input is seen as a number that has a zero "0" at the beginning and therefor removes it as an integer will not have a zero in the front. So in this instance, we would need to consider the use of text, and then apply some rules to it, using an input mask, and defining its field length to the same as a telephone number.
| Table Name | Games |
| Field Name | Attributes |
| Game_ID | Primary Key, Integer |
| Game_Title | Text,25 characters, no validation, no input mask |
| Producer |
Text,25 characters, no validation, no input mask |
| Genre | Text, Using a look-up table to display the following options, "Fighter", "Racing", "Role Play" |
| Price | Currency, |
| Platform_ID | Foreign Key, Must be an entry on the Console platform table. |
| Pegi Rating | Text using a look-up table to display the following options "3", "7", "12", "16", "18" |
| Table Name | Console Platform |
| Field Name | Attributes |
| Platform_ID | Primary Key, Integer |
| Platform_Name | Text,25 characters, no validation, no input mask |
o use of naming conventions
When creating any database using any DBMS tool there are is guidance and rules that should be followed to ensure that the database once set up is easy to manage and maintain. Some of the simplest are the naming conventions that should be adopted. When creating forms, reports, queries, and tables we should follow the below;
frm_Form_Name = form
qry_Query_Name = Query
tbl_Table_Name = Table
rpt_Report_Name = Report
o entity-relationship diagrams
An entity-relationship diagram is used to visually demonstrate the links between the intended tables, it will identify the primary keys that will be implemented and the foreign keys that will be used to link the tables. The image will use special symbols to represent the links and also the primary and foreign keys, these are as follows
ENTER IMAGE OF RELATIONSHIP DIAGRAM SYMBOLS HERE
o normalisation
As covered in the previous weeks, you will r through a normalisation process that requires you to break the tables down, this process should be demonstrated and presented, this could look something like below;
UNF: name, surname, address 1, address 2, post code, telephone number, person_id,
1st NF: person_id, name, surname
address 1, address 2, postcode, telephone
2nd NF : person_id, name, surname
house_id, address 1, address 2, postcode, telephone
3rd NF : person_id, name, surname
house_id, person_id, address 1, address 2, postcode, telephone
Try the following exersicse on normalisation. Thanks to seneca college
Exercise 1
Exercise 2
Exercise 3
Exercise 4
• user interface design:
o data entry/input – verification, validation, calculated fields, masks, directed input
It is again key to represent how you intend on the solution will work, but also its visual representation. your solution will need to be appropriate for the user to be able to input in to the system using data input screens, the layout of these need to be as straight forward as possible, if the user is unclear as to the inputs needed then the data going in to the system may jeopardise the content in the system already and essentially provide misinformation as an output. So creating mock-ups of the input screen will allow clients and test users to have input before the solution is created, saving time and also potential issues later. Within these designs the type of inputs and features that are going to be appearing need to be clearly identified too, for example, input masks, colours , verification areas, button names.
o reports – fields, queries, presentation of data, calculations
As with the design on the input forms that output needs to be designed and consider too. The use of the reporting element within a database and especially in the access tool enables users to get output in a representation that can enable them to give quick and informed suggestions to thier company or services.
So in the design of the reports key information such as the titles and calculated columns need to be identified.
o task automation – imports, updates, deletions
• extracting and presenting data:
o queries using multiple criteria, form values, and wild cards
When creating a query we are able to search using part of a criteria. In the screenshot below, you will be able to see that there are 3 entries about a beach.
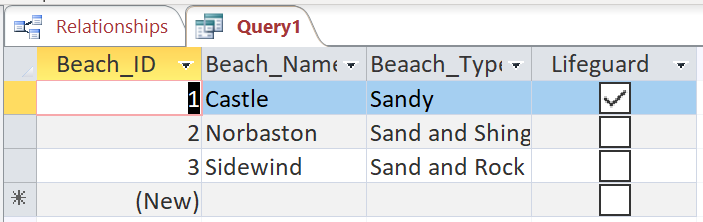
When we move to the design view we can begin to construct our criteria using part of the criteria.

In this instance, you will be able to see that the criteria that we are looking at is asking the database to display any results that have "sand and *" (the * tells the database to allow for anything after). The result displayed will be,
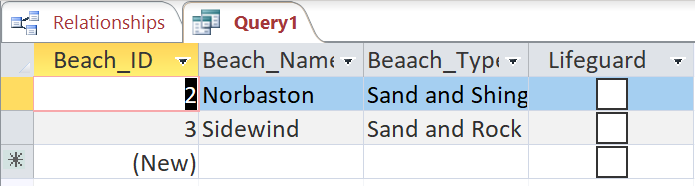
So, in this example our planning would allow us to work out that we would need the following statement; Like "sand and*" to enable us to display the previous output.
o action queries
o calculated queries
A calculated query can be very powerful when dealing with a large amount of data that is required to have information calculated from it. In the following example we will use a sweet shop. The sweetshop has a large amount of sweets that it stocks and the cost of these sweets is recorded in the table against the sweets name. However, the owner would like a query that adds on a 10p profit to each sweet and to add the VAT charge too. This is easily achieved in access by doing the following.

As the image above demonstrates we will add another field, in this case, Net Cost. This is achieved by simply typing the field name followed by a : then we are now able to identify the field that we wish to take the value from, in this instance, it is "Sweet_Cost" in order to tell access this we need to enclose the name inside square brackets [ ]. Our calculation now moves on to the addition of the 10p, and then finally outside of our original brackets, we will now add the VAT calculation on the cost of the sweets that have had the 10 added.
So our criteria should read, Net Cost: ( [Sweet_Cost] + 10) * 1.2
Yes the eagle eyes will spot that we are adding 20% to the cost and because we are adding this value to the original value we put 1 in front of the 0.20 calculation.
So the output should look at pictured below;

Further video of how to create calculated fields
o reports
• design and use of test plans: to check correctness of data, functionality,
accessibility, usability.
Last Updated
2024-09-04 14:24:29
English and Maths
English
Reading: Read and understand texts, selecting material appropriate to purpose, collating from different sources and making comparisons and cross-references as appropriate.
Interactive Speaking : Interact with others, shaping meanings through suggestions, comments and questions and drawing ideas together.
Maths
Analysis of information: Interpreting Results, Drawing conclusions from data, Comparing data
Organising and Representing data: Drawing tables, charts and graphs
Formulae: using formulas, using words to express operations e.g. direction
Stretch and Challenge
Stretch and Challenge
- Fast to implement
- Accessible by default
- No dependencies
Homework
Homework
Equality and Diversity Calendar
How to's
How 2's Coverage
Anonymous Assessment - Learners assess an anonymous piece of work containing deliberate mistakes against given success criteria.
Question and Answer - Verbal discussion with learners to quantify understanding
Product Evidence - Learners to create product evidence to demonstrate understanding
Anonymous Assessment - Learners assess an anonymous piece of work containing deliberate mistakes against given success criteria.
Links to Learning Outcomes |
Links to Assessment criteria |
|
|---|---|---|
AO1 Demonstrate knowledge of database development terminology, standards, concepts and processes AO2 Apply knowledge and understanding of database development terminology, standards, concepts and processes to create a software product to meet a client brief AO3 Analyse information about database problems and data from test results to optimise the performance of a database solution
|
Files that support this week
Week 4→
Next 4Week 5→
Next 5Week 6→
Next 6←
Prev4