| Week 1 | T&L Activities:
1.1.1 The definition and the purpose of computational thinking.Computational thinking is a structured way of approaching problem-solving that breaks down complex challenges into smaller, more manageable steps. Its purpose is not just to enable coding or programming but to apply logical thinking, pattern recognition, abstraction, and algorithmic design to a wide range of problems. In practice, it allows individuals to analyse issues systematically, identify repeated processes, and develop step-by-step strategies to resolve them efficiently. For example, when managing a digital support service desk, computational thinking helps technicians triage faults by categorising common errors, identifying patterns in system failures, and applying logical troubleshooting steps to reach a resolution. This approach ensures consistency, reduces wasted time, and supports effective decision-making when multiple possible solutions exist. Within the digital support and security sector, the application of computational thinking is vital for safeguarding networks, systems, and data. In cyber security incident response, analysts use abstraction to filter irrelevant noise from security logs, decomposition to break down an intrusion into stages, and algorithmic thinking to design repeatable response playbooks. Similarly, in support roles, staff apply pattern recognition when monitoring system performance or spotting trends in user behaviour that may signal a phishing attack or malware infection. By embedding computational thinking into daily practice, professionals can ensure that problem-solving is both systematic and adaptable, which is essential for maintaining resilience and compliance in modern digital environments. Exam Question (8 Marks)
"Compute This Activity Worksheet" 1.1.2 When to use computational thinking.Computational thinking should be used whenever problems are too complex to be solved through guesswork or ad-hoc approaches, and instead require a structured, logical process. It is particularly valuable when dealing with problems that are repeated, involve large amounts of data, or where accuracy and security are critical. For example, in cyber security monitoring, support staff use computational thinking to identify patterns in suspicious login attempts, separating genuine user errors from potential brute-force attacks. In digital support, computational thinking helps technicians decide when to automate routine processes such as password resets or system backups, ensuring consistency and efficiency. It may not be necessary for simple, one-off issues, such as a single user forgetting a password, but becomes essential in system-wide incidents or long-term projects like cloud migrations. Within the digital support and security sector, applying computational thinking ensures resilience by breaking problems into manageable parts, filtering irrelevant information, and creating structured, repeatable solutions that safeguard both system performance and data security.
"When should I"
Exam Question (8 marks)
1.1.3 The benefits and drawbacks of using computational thinking.Benefits of Computational Thinking
Drawbacks of Computational Thinking
Situations Where Computational Thinking Has Helped an Organisation
Situations Where Computational Thinking Has Caused Drawbacks
Investigative Activity – Directed to You
1.1.4 The components of computational thinking:Computational thinking isn’t just “thinking like a computer.” It’s about breaking problems down and solving them in logical, structured ways that make sense to both humans and machines. Four key components make up computational thinking: DecompositionWhat it is: Example in use:
Benefit: Makes complex problems less overwhelming and easier to solve. Pattern recognitionWhat it is: Example in use:
Benefit: Saves time by applying solutions to similar problems. AbstractionWhat it is: Example in use:
Benefit: Simplifies complex problems so solutions are easier to design. Algorithmic design.What it is: Example in use:
Benefit: Provides clear, repeatable instructions that can be automated. Situations Where These Components Helped Organisations
Situations Where Components Caused Drawbacks
Task: Analysing the Components of Computational Thinking in Action 1.1.5 The benefits and drawbacks of using the components of computational thinking.Computational thinking is built from four components: decomposition, pattern recognition, abstraction, and algorithmic design. Each has strong advantages in problem-solving, but also risks and drawbacks when applied in real-world contexts. DecompositionBenefits:
Drawbacks:
Pattern RecognitionBenefits:
Drawbacks:
AbstractionBenefits:
Drawbacks:
Algorithmic DesignBenefits:
Drawbacks:
1.1.6 The purpose of decomposition.What is decomposition?Decomposition is the process of breaking a big, complex problem into smaller, more manageable parts. Instead of trying to solve everything at once, you deal with one piece at a time. Think of it like revising for an exam: instead of reading the entire textbook cover to cover, you split it into topics (e.g., networking, security, databases) and tackle each one in turn. Why is decomposition important?
Possible drawbacks of decomposition
This is why decomposition works best when combined with good planning and communication.
Files that support this week | English:
|
Assessment:
|
Learning Outcomes:
|
Awarding Organisation Criteria:
|
||||||||||||||||||||||||||||||||||||||||||||||||
| Maths:
|
|||||||||||||||||||||||||||||||||||||||||||||||||||||
| Stretch and Challenge:
|
E&D / BV | ||||||||||||||||||||||||||||||||||||||||||||||||||||
| Homework / Extension:
|
ILT | ||||||||||||||||||||||||||||||||||||||||||||||||||||
| → | → | → | → | → | → | ||||||||||||||||||||||||||||||||||||||||||||||||
| Week 2 | T&L Activities:
1.1.7 The tasks of decomposition:• identify the main features of a problem • characterise each identified feature • break problems down into smaller, more manageable parts • break solutions down into smaller, more manageable parts.
1.1.8 How to use decomposition for problem solving.
1.1.9 The methods to represent decomposition:
• block diagrams • information flow diagrams • flowcharts • written descriptions.
1.1.10 How to use methods to represent decomposition.
1.1.11 The purpose of pattern recognition
1.1.12 How to use pattern recognition for problem solving:
• find and interpret trends and similarities within and between problems and processes • find and interpret common features between a given problem and existing solutions • make predictions and assumptions based on identified patterns. Files that support this week | English:
|
Assessment:
|
Learning Outcomes:
|
Awarding Organisation Criteria:
|
||||||||||||||||||||||||||||||||||||||||||||||||
| Maths:
|
|||||||||||||||||||||||||||||||||||||||||||||||||||||
| Stretch and Challenge:
|
E&D / BV | ||||||||||||||||||||||||||||||||||||||||||||||||||||
| Homework / Extension:
|
ILT | ||||||||||||||||||||||||||||||||||||||||||||||||||||
| → | → | → | → | → | → | ||||||||||||||||||||||||||||||||||||||||||||||||
| Week 3 | T&L Activities:
1.1.13 The purpose of abstraction.
1.1.14 The tasks of abstraction:• identify information that is needed • filter out unnecessary details • hide details of internal workings.
1.1.15 How to use abstraction:• what inputs are needed • what the expected outputs and outcomes are • things that will vary • things that will remain constant • key actions the solution must perform • repeated processes the solution will perform.
1.1.16 How to use abstraction in problem solving.
1.1.17 The interrelationships between components of computational thinking and make judgements about the suitability of using the components in digital support and security
Files that support this week | English:
|
Assessment:
|
Learning Outcomes:
|
Awarding Organisation Criteria:
|
||||||||||||||||||||||||||||||||||||||||||||||||
| Maths:
|
|||||||||||||||||||||||||||||||||||||||||||||||||||||
| Stretch and Challenge:
|
E&D / BV | ||||||||||||||||||||||||||||||||||||||||||||||||||||
| Homework / Extension:
|
ILT | ||||||||||||||||||||||||||||||||||||||||||||||||||||
| → | → | → | → | → | → | ||||||||||||||||||||||||||||||||||||||||||||||||
| Week 4 | T&L Activities:1.2 Algorithmic design1.2.1 The definition and understand the characteristics and purpose of algorithms
1.2.2 The methods to express algorithms:
|
| Symbol | Name | Function |
|---|---|---|
| Terminator | Shows the start or end of the process. Typically labelled Start or End. | |
| Process | A single step or instruction, e.g., Calculate total cost. | |
| Sub-process | Represents a smaller, reusable algorithm called within the main process. | |
| Decision | A question that results in Yes/No or True/False branches. | |
| Input/Output | Represents data being entered or displayed (e.g., Input username or Display result). | |
|
|
Arrow | Shows the flow or direction of the algorithm. |
| [Label] | Label | A text marker or reference point to clarify flow or connect parts of the chart. |
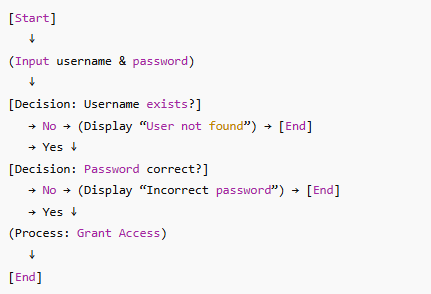
Example Flowchart Login Validation System
Scenario
A college’s student login portal checks user credentials before allowing access.
Flowchart Steps
-
Start
-
Input username and password
-
Check if username exists in the database
-
Decision: If No, display “User not found” > Go to End
-
If Yes, verify password
-
Decision: If password incorrect > display “Incorrect password” > End
-
If correct, grant access
-
End
Flowchart Visual Summary (Text-based)
Case Study: Airport Check-in Kiosk
An automated self-service check-in kiosk uses a flowchart algorithm to manage passengers:
-
It starts when the passenger touches the screen.
-
It inputs passport data.
-
It decides whether the flight is valid for check-in.
-
If yes, it prints a boarding pass.
-
If not, it displays an error message.
By following a flowchart, engineers can debug or enhance the kiosk’s logic quickly.
"Feel the Flow"
You are designing a college printing system.
Create a simple flowchart showing how a student prints a document using the college printer. Include:
A start and end symbol
At least one input/output (e.g. “Upload file”)
One decision (e.g. “Does student have enough credit?”)
One process (e.g. “Send file to printer”)
Arrows to show direction
Extension:
Label your decision outcomes (Yes/No) clearly.
Written Descriptions Using Hierarchical Markers
Some algorithms are best expressed in written structured form - especially when precision or documentation is important.
This format uses hierarchical markers (e.g., numbers and letters) to show sequence and sub-steps.
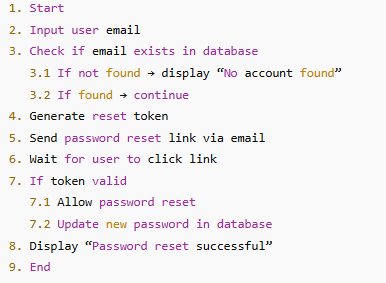
Example: Password Reset Algorithm (Written Description)
Why use this method?
-
Ideal for system documentation or planning code.
-
Helps non-visual learners see the order of logic.
-
Easy to convert into pseudocode or actual programming logic.
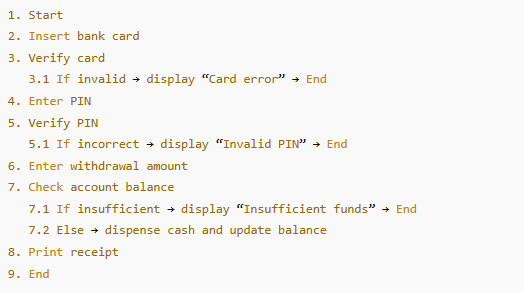
Case Study: Bank ATM Transaction Process
A software developer describes the ATM withdrawal algorithm in hierarchical format:
Write a Hierarchical Algorithm
You have been asked to describe the algorithm for booking a college IT suite using a written hierarchical format.
Your steps should include:
Input of booking details (room, date, time)
Checking for availability
Confirmation message if successful, or error if not
Example start:
1. Start
2. Input room, date, and time
3. Check if available
........
Extension:
Add sub-steps for what happens if the booking is rejected.
1.2.3 The benefits and drawbacks of expressing algorithms in flowcharts.
Flowcharts are a visual method of expressing algorithms using standardised symbols to represent processes, decisions, inputs, and outputs. One of the major benefits of using flowcharts is their ability to make complex algorithms easier to understand and communicate. Visual representations allow programmers, designers, and even non-technical stakeholders to quickly follow the logic of a process step-by-step. This helps in identifying errors or inefficiencies early in the design stage, saving time and resources during implementation. Flowcharts also provide a universal language — standard symbols make them accessible across industries and educational settings. For example, when troubleshooting or documenting legacy systems, a flowchart can offer a quick visual summary of the logic behind a process without requiring extensive code analysis.
However, there are drawbacks to relying heavily on flowcharts for algorithm design. As systems grow in complexity, the flowcharts can become unwieldy and difficult to manage. A small change in logic may require redrawing large portions of the diagram, reducing efficiency. Overly detailed flowcharts can also become confusing, defeating their purpose of simplifying understanding. Furthermore, unlike pseudocode, flowcharts lack flexibility for precise algorithmic notation and cannot easily express concepts like recursion or dynamic structures. In collaborative environments, inconsistencies in symbol use or layout can lead to misinterpretation among team members, particularly if version control is not well managed.
Case Study 1 – Benefit
Organisation: NHS IT Department
Scenario: The department developed an algorithm to manage patient check-in processes at local clinics.
Outcome: By expressing the process in a flowchart, non-technical healthcare managers were able to visualise the logic of patient routing between reception, triage, and consultation. The diagram identified bottlenecks and led to redesigning part of the process to include an automatic queuing system. As a result, waiting times were reduced by 15%, and data entry errors were halved. The flowchart’s clarity allowed both technical and non-technical staff to collaborate effectively.
Case Study 2 – Drawback
Organisation: Fintech start-up developing fraud detection algorithms
Scenario: The development team initially designed all their decision-making processes using large flowcharts.
Outcome: As the algorithms grew to include hundreds of conditions and nested decisions, the flowcharts became so complex that maintaining them was impractical. Different developers misinterpreted some conditions, resulting in inconsistent implementations. Eventually, the company switched to pseudocode and modular diagrams to represent the logic more efficiently. This case highlighted how flowcharts can hinder large-scale development if they are not modularised or properly managed.
Title: Research and Evaluate the Use of Flowcharts in Algorithm Design
Instructions to the Student:
You are working as a junior technician for a software development company. Your team uses flowcharts to map out system processes before programming begins.
1. Research two real-world examples of how flowcharts are used in system or algorithm design (for example, healthcare, logistics, or gaming).
2. For each example, describe:
- What process or algorithm was expressed using a flowchart.
- What benefits or challenges were experienced.
3. Summarise your findings in a short report (200–250 words) explaining whether you think flowcharts are more beneficial or limiting for complex systems.
4. Include one image or diagram from your research if possible.
Mock Exam Question (Based on T-Level DSS Format)
Question 14 (b)
Flowcharts are often used to represent algorithms in digital system design.
Evaluate the suitability of using flowcharts to design a new automated customer booking system for a travel company.
Your answer should consider both benefits and drawbacks of using flowcharts in this context.
(9 marks)
Suggested Mark Scheme (Levels-Based – aligned to Pearson T-Level DSS style)
1-3 Marks: Demonstrates a basic understanding of flowcharts with limited reference to their advantages or disadvantages. Provides simple statements without linking to the context of a booking system. Limited use of terminology or examples.
4-6 Marks: Demonstrates a good understanding of how flowcharts can be used to design systems. Provides relevant advantages and disadvantages, with some application to the travel company scenario. Some justifications are developed but lack full evaluation.
7-9 Marks: Demonstrates a thorough understanding of the suitability of flowcharts for system design. Provides well-balanced evaluation of both benefits (e.g. visual clarity, stakeholder communication) and drawbacks (e.g. complexity, maintenance). Applies reasoning clearly to the booking system scenario and reaches a supported conclusion.
Indicative Content:
Benefits: simple to understand, visual, supports team communication, aids debugging and documentation.
Drawbacks: complex systems become cluttered, time-consuming to edit, less efficient for conditional logic, lacks scalability.
Contextual application: travel booking systems include many branches (e.g. destinations, seat types, availability), making flowcharts useful for high-level overview but poor for detailed rule logic.
1.2.4 The benefits and drawbacks of expressing algorithms in written descriptions.
Written descriptions (such as pseudocode or step-by-step written explanations) are another method of expressing algorithms. One major benefit of using written descriptions is that they provide precise, structured logic that closely resembles programming syntax. This makes them useful for planning before coding and for teaching logical thinking. Written descriptions can also handle complex conditions and iterations more effectively than flowcharts, because textual notation allows programmers to include multiple variables, nested loops, and conditionals without the visual clutter of a diagram. In professional settings, written algorithms are easy to version control, edit, and share using digital tools such as code editors or documentation systems. This supports collaboration among programmers and ensures consistency when converting designs into working code.
However, there are also drawbacks to expressing algorithms purely in written form. Written descriptions can be less accessible to non-technical audiences who might struggle to interpret pseudocode or programming-style logic. Ambiguity can occur if there is no standardised format, meaning two programmers might interpret a description differently. In addition, lengthy written descriptions can make it difficult to quickly visualise the flow or dependencies between steps, which can lead to missed logic errors. For beginners, long sequences of text may be harder to follow than diagrams, reducing their usefulness for early-stage communication or training purposes.
Title: Research and Compare the Use of Written Descriptions in Algorithm Design
Instructions to the Student:
You are a junior systems developer asked to research how written descriptions (including pseudocode or structured English) are used in industry.
1. Research two examples where written descriptions have been used to design or communicate an algorithm (for example, banking systems, logistics routing, robotics, etc.).
2. For each example, describe:
- What process or algorithm was expressed in written form.
- What benefits and challenges were identified.
3. Summarise your findings in a short written report (200–250 words) explaining whether written descriptions are better suited to technical or mixed audiences, and justify your opinion.
4. Include at least one short snippet of pseudocode or written algorithm from your research to support your discussion.
Mock Exam Question (Based on T-Level DSS Format)
Question 13 (b)
Algorithms can be expressed in written descriptions, such as pseudocode or structured English.
Evaluate the suitability of using written descriptions to design an algorithm for an automated stock-management system in a warehouse.
(9 marks)
1-3 Marks: Demonstrates a basic understanding of written descriptions with limited reference to advantages or disadvantages. Provides general statements not applied to the warehouse context. Little or no justification.
4-6 Marks: Demonstrates a good understanding of how written descriptions can be applied to algorithm design. Gives relevant benefits and drawbacks with partial application to the warehouse system. Some explanation or reasoning provided but evaluation may be unbalanced.
7-9 Marks: Demonstrates a thorough understanding and clear evaluation of the suitability of written descriptions. Considers both benefits (clarity, precision, ease of coding) and drawbacks (lack of visual flow, accessibility) in context of the warehouse stock-management system. Provides a balanced and well-supported conclusion.
Indicative Content:
Benefits: precise notation, easily edited, supports collaboration in software teams, can handle complex loops and conditions, suitable for automation design.
Drawbacks: not visually intuitive, difficult for non-technical users, may lack standardisation, prone to misinterpretation if poorly written.
Contextual application: a warehouse stock-management algorithm might involve multiple conditional checks (e.g. item levels, expiry dates, restock triggers). Written descriptions are ideal for programmers but might not clearly show process flow to warehouse managers or stakeholders.
1.2.5 The actions to control ordering of steps in algorithms:
Algorithms rely on logical structures to control the order in which actions occur. This ensures that computers follow clear, predictable patterns to produce correct results. There are three main control structures used in algorithm design: sequence, selection, and iteration.
Sequence
A sequence is a set of steps executed in a fixed order. Each instruction happens one after another, without skipping or repeating. For example, a printer queue follows a sequential process: receive document → check ink → print → eject paper. In algorithmic terms, sequence represents the simplest form of control, ensuring consistency and predictability. However, sequence alone cannot handle decisions or repetition, so it’s usually combined with selection and iteration.
Selection
Selection introduces decision-making into an algorithm. It allows a program to choose between different paths based on a condition — often expressed as “IF… THEN… ELSE.” For example, a login system checks whether a password matches a stored value. If it matches, access is granted; if not, access is denied. Selection makes algorithms flexible, allowing different outcomes based on input or state.
Iteration
Iteration is repetition — repeating a set of instructions until a condition is met. It’s used when tasks need to happen multiple times, such as checking each item in a list or monitoring sensor data. Loops like “FOR,” “WHILE,” or “DO UNTIL” are common examples. Iteration saves time and reduces errors by automating repetitive actions rather than writing them out multiple times.
Together, sequence, selection, and iteration form the foundation of all algorithmic logic. Every computer program, from a simple calculator to an operating system, uses these three structures to control the flow of operations and make decisions dynamically.
“Algorithm Walkabout”
Time: 10 minutes Type: Active individual task with discussion
Your challenge
You’re going to get up, move around the room, and explore how the three main control structures — Sequence, Selection, and Iteration — appear in real-life situations and digital systems.
Each of you will think of examples, share them with others, and explain your reasoning.
Step 1 – Think of your example (2 minutes)
You’ll be given a sticky note or small card.
On it, write one example of a situation that uses sequence, selection, or iteration.
Try to think of something from real life or from technology.
Here are some ideas to help you:
Sequence: following a recipe, installing an app, starting a computer.
Selection: deciding if a password is correct, approving a payment.
Iteration: scanning multiple files for viruses, looping through playlist songs.
Step 2 – Walkabout and post your example (4 minutes)
Around the room you’ll see three posters labelled:
- Sequence
- Selection
- Iteration
1. Decide which control structure your example fits best.
2. Walk over and stick your note in that area.
3. While moving around, read at least two other examples from other students.
4. Speak to at least one classmate and discuss why their example fits that structure — you can ask questions or challenge their reasoning.
Step 3 – Share and explain (4 minutes)
Your teacher will pick a few examples from each section of the room.
If yours is chosen, be ready to explain why you placed it there.
You might be asked:
- Why does your example show sequence, selection, or iteration?
- What would happen if you changed the order or missed a step?
- Listen to others’ explanations and think about whether you agree or disagree — be prepared to explain your opinion.
What you should understand by the end
By the time you finish this walkabout, you should be able to:
- Identify sequence, selection, and iteration in real or digital systems.
- Explain how each structure controls the order of steps in an algorithm.
- Discuss your ideas clearly with other people and justify your reasoning.
1.2.6 How to determine the purpose of an algorithm and how it works.
“Be the Algorithm Detective – Present Your Findings”
Topic: How to determine the purpose of an algorithm and how it works
Duration: 25–30 minutes
Format: Individual or pairs → short presentation (3 slides + talk)
Your Mission
You are an Algorithm Detective.
Your goal is to examine one example algorithm, work out what it is designed to do and how it achieves that goal, and then present your analysis to the class.
Step 1 – Choose or Receive an Algorithm (3 min)
Your teacher will give you or your group a small algorithm sample (pseudocode or flowchart).
Examples might include:
Calculating an average mark
Determining whether a number is even or odd
Validating a password
Counting login attempts
Step 2 – Investigate (10 min)
On paper or in notes, answer these questions:
Inputs and Outputs –
What information goes in? What comes out?
Purpose –
What is the overall goal of this algorithm?
(Summarise it in one sentence.)
Process –
Describe the steps it takes.
Identify where it uses sequence, selection, or iteration.
Evidence –
Run through an example with your own sample data to prove it works.
Step 3 – Create a Mini-Presentation (10 min)
Build a 3-slide presentation titled “Algorithm Detective Report.”
Slide 1 – The Algorithm
Show or restate your algorithm example.
Label the inputs and outputs.
Slide 2 – Purpose and How It Works
Explain what the algorithm is designed to do and summarise the main steps in plain English.
Highlight any sequence, selection, or iteration.
Slide 3 – Reflection & Improvements
Explain:
What clues helped you determine its purpose?
What did you learn about how algorithms are structured?
Could this algorithm be improved or written differently?
Tip: Keep text short and visual. Use shapes, arrows, or short pseudocode blocks.
Step 4 – Share and Discuss (5–10 min)
Each group (or a few volunteers) presents their slides to the class.
As you listen to others, note:
Did they identify the same or different purpose?
Did they explain how it works clearly?
What patterns appear across all algorithms?
After all presentations, join a short class discussion led by your teacher about how to recognise an algorithm’s purpose and process.
Files that support this week
1.2.7 How to determine the output of an algorithm given an input.
1.2.8 How to identify errors in an algorithm.
What is an Algorithm Error?
An error in an algorithm is a mistake in its logic or design that causes it to behave unexpectedly - producing incorrect, incomplete, or no results.
These errors can happen before programming (in pseudocode or flowcharts) or after (in the coded version).
Finding errors early is vital - it saves time, reduces system faults, and improves efficiency.
2. Types of Errors You Might Find
a) Logical Errors
-
These occur when the logic or order of steps is wrong, even though the syntax (format) looks fine.
-
The algorithm runs but gives the wrong result.
-
Example:
INPUT number OUTPUT number * 2Intended to square the number, but instead doubles it — a logical error.
How to spot it:
Run through sample data manually and compare the output to what’s expected.
b) Syntax or Structure Errors
-
These happen when rules of structure are broken — like missing an “END IF” in pseudocode or an arrow in a flowchart.
-
The algorithm can’t be followed correctly.
How to spot it:
Check for missing connectors, mismatched conditions, or incorrect flowchart symbols.
In code, this is like a compiler or interpreter error.
c) Runtime or Loop Errors
-
These occur while the algorithm is running, often caused by infinite loops or invalid operations (e.g., dividing by zero).
-
The algorithm “hangs,” “crashes,” or never completes.
How to spot it:
Trace the algorithm with different data sets to see if any loops never end or if calculations fail.
d) Input/Output Errors
-
Caused by misunderstanding what type or range of data is expected.
-
Example: expecting a number but getting a string like “five”.
How to spot it:
Check data types and use validation — make sure inputs match the algorithm’s expected format.
3. Techniques for Finding Errors
a) Dry Running
Dry running means manually stepping through the algorithm using sample data.
You record the value of each variable at each step — usually in a trace table.
| Step | Input | Calculation | Output | Comment |
|---|---|---|---|---|
| 1 | 5 | 5 * 2 | 10 | Works as expected |
| 2 | 5 | 5 * 5 | 25 | Correct after fix |
This helps you see exactly where results start going wrong.
b) Desk Checking
Desk checking is a mental simulation of how an algorithm behaves.
You check:
-
Does the logic make sense?
-
Are decisions handled correctly?
-
Do loops terminate properly?
This is often done before coding.
c) Tracing
Tracing uses visual tools like flowcharts or debugging output statements to show how the algorithm executes each step.
For example, printing variable values at each stage or watching arrows in a flowchart helps find where it deviates from expected logic.
d) Testing
Testing means running the algorithm with different test data sets:
-
Normal data: expected input values
-
Boundary data: at the limit of what’s acceptable
-
Erroneous data: invalid input to see if it’s handled correctly
This confirms whether logic and validation work properly.
4. Step-by-Step Process for Error Identification
-
Read the algorithm carefully.
Understand what it should do — this is your baseline. -
Predict the output.
Before running it, say what the output should be for specific inputs. -
Trace the algorithm manually.
Use a trace table to record variable values and check for unexpected results. -
Identify mismatches.
If the actual output doesn’t match your prediction, find which step caused the change. -
Check control structures.
Are sequence, selection, and iteration correctly used? -
Revise and re-test.
Make corrections and test again until results match the intended outcome.
5. Example:
Algorithm (in pseudocode):
INPUT number WHILE number > 0 total = total + number END WHILE OUTPUT total
Expected behaviour:
To add up positive numbers entered by the user.
Problem:
The algorithm doesn’t reduce number inside the loop — it becomes infinite.
Fix:
Add a line number = number - 1 inside the loop.
6. Summary Table
| Error Type | Example | How to Find It |
|---|---|---|
| Logical | Wrong calculation order | Dry run or trace |
| Syntax | Missing END IF | Desk check structure |
| Runtime | Infinite loop | Test or simulate |
| Input/Output | Wrong data type | Test with sample inputs |
1.2.9 How to correct errors in an algorithm.
1.2.10 How to design algorithms and solutions that use actions.
What Are Actions in Algorithms?
In an algorithm, actions are the individual operations or commands that make the system do something.
They are the steps that make change happen.
Examples of actions include:
-
Input: getting data from a user or system
-
Processing: performing calculations or transformations
-
Output: showing or sending results
-
Control: repeating or deciding what happens next
Think of actions as the verbs in an algorithm — they describe what actually occurs.
2. The Four Common Types of Actions
| Action Type | Purpose | Example in Pseudocode |
|---|---|---|
| Input | Collects data from user or system | INPUT temperature |
| Process | Calculates or transforms data | average = (num1 + num2 + num3)/3 |
| Selection | Makes a decision based on a condition | IF password = storedPassword THEN access = "granted" |
| Iteration | Repeats actions until a condition is met | FOR i = 1 TO 10PRINT iNEXT i |
| Output | Displays or returns results | OUTPUT "Your total is ", total |
When designing an algorithm, you combine these actions logically to create a sequence of operations that solve a problem.
3. How to Design Algorithms Using Actions
Step 1: Define the Problem Clearly
What needs to be solved?
Example: Calculate the total cost of items including VAT.
Step 2: Identify the Inputs and Outputs
-
Input: item prices, VAT rate
-
Output: total cost with VAT
Step 3: Break Down the Processing Steps
Think of the actions needed to transform input into output.
Example sequence of actions:
-
Ask the user for prices.
-
Add them together.
-
Multiply the total by VAT rate.
-
Display the result.
Step 4: Choose Control Structures
Decide whether you need:
-
Sequence: Steps done in order
-
Selection: Choices (e.g. apply discount if total > £50)
-
Iteration: Repeats (e.g. add prices for multiple items)
Step 5: Represent as Pseudocode or Flowchart
You can design algorithms using flowcharts or pseudocode to show the actions clearly.
4. Worked Example 1 – Using Actions in Pseudocode
Problem: Calculate the average of three test scores.
INPUT score1 INPUT score2 INPUT score3 total = score1 + score2 + score3 average = total / 3 OUTPUT "The average score is", average
Actions Used:
-
Input: get the scores
-
Process: add and divide
-
Output: show the result
5. Worked Example 2 – Using Actions with Decisions and Loops
Problem: Create an algorithm that checks whether a user’s password is correct, with three attempts allowed.
attempts = 0 WHILE attempts < 3 INPUT password IF password = "Cyber123" THEN OUTPUT "Access Granted" STOP ELSE OUTPUT "Incorrect password" attempts = attempts + 1 END IF END WHILE OUTPUT "Account locked"
Actions Used:
-
Input: user enters password
-
Process: compare input to stored password
-
Selection: choose different actions based on condition
-
Iteration: loop gives up to 3 attempts
-
Output: display results or lock message
6. Designing Effective Solutions
When designing algorithms using actions:
-
Keep steps clear and simple
-
Use comments or labels to explain what each action does
-
Check that every input has a purpose and every output is supported by process steps
-
Test the algorithm with sample data to ensure all actions work together correctly
“Action Architect Challenge”
Duration: 20 minutes
Type: Individual or pair work
Scenario:
You have been asked to design an algorithm for a college system that calculates a student’s final grade.
The system must:
1. Ask the student for three assignment scores
2. Work out the average score
3. Display a grade based on this scale:
70–100 → “Distinction”
50–69 → “Merit”
30–49 → “Pass”
Below 30 → “Fail”
Design an algorithm using actions (input, process, selection, and output) to solve this problem.
You must:
1. Write your algorithm as pseudocode or draw it as a flowchart.
2. Identify each action type (label them as Input, Process, Selection, Output).
3. Test your algorithm using three different sets of scores to check that it works correctly.
4. Write a short reflection:
How did you decide on the sequence of actions?
Which action type was most important and why?
Extension (optional)
Add iteration: allow the program to repeat for multiple students until the user types “STOP.”
1.3 Strategies
1.3.1 The different approaches to solving problems and understand their purpose and when they are used:
- • top-down
• bottom-up
• modularisation.
1.3.2 The benefits and drawbacks of using the different approaches to solving problems
Files that support this week
1.3.3 The purpose of root cause analysis and when it is used.
Root Cause Analysis (RCA) is a structured problem-solving method used to identify the underlying reason why a fault, incident, or failure has occurred, rather than just treating the visible symptoms. Its purpose is to ensure that organisations can prevent the same problem from happening again by uncovering what actually caused it whether that is a technical issue, a human-error chain, a process failure, or a combination of several factors. RCA is typically used after significant incidents such as system outages, security breaches, recurring faults, health and safety incidents, or quality-control failures. It is most valuable when a problem is persistent, high-impact, or costly, and when simply fixing the immediate issue does not guarantee long-term stability. By identifying the true root cause and implementing corrective actions, organisations improve reliability, strengthen processes, enhance safety, and reduce long-term operational risk.
1.3.4 The approaches to root cause analysis:
Five whys
An iterative questioning technique, the 5 Whys is a simple but effective way to get to the bottom of a problem by asking “why” five times, or more if needed. It’s like peeling back layers of an onion, going deeper each time until you find the true cause of the issue, not just the surface-level problem.
Here’s how it works:
• You start by identifying the problem.
• Then, you ask why the problem happened.
• After you get the first answer, you ask why again to dig deeper.
• You keep repeating this process, usually about five times, until you uncover the root cause of the issue.
In digital support services, this technique helps teams figure out why things go wrong, whether it’s related to technology not working, users having issues, or systems failing. By understanding the true cause, companies can fix problems effectively and prevent them from happening again.
Example Case Studies in Digital Support Services:
1. Slow Website Performance
• Problem: Users report that a website is loading slowly.
• 1st Why: Why is the website slow? Because the server response time is long.
• 2nd Why: Why is the server response time long? Because it’s overloaded with too many requests.
• 3rd Why: Why are there too many requests? Because a lot of bots are making fake requests.
• 4th Why: Why are bots making fake requests? Because there’s no filtering system in place to block them.
• 5th Why: Why is there no filtering system? Because it wasn’t set up during the website’s initial configuration.
• Solution: Set up a bot-blocking system to reduce server load and improve performance.
2. Customer Complaints About Software Crashing
• Problem: A company’s support team receives multiple complaints that their app is crashing.
• 1st Why: Why is the app crashing? Because it’s running out of memory.
• 2nd Why: Why is it running out of memory? Because it’s using too much data.
• 3rd Why: Why is it using too much data? Because the images in the app are not compressed.
• 4th Why: Why aren’t the images compressed? Because the developers didn’t optimize them.
• 5th Why: Why weren’t the developers optimizing images? Because they weren’t aware of the issue until users complained.
• Solution: Train developers on data optimization and perform regular app performance tests.
3. Repeated Failed Logins by Customers
• Problem: Customers are having trouble logging into their accounts.
• 1st Why: Why can’t they log in? Because their passwords are being rejected.
• 2nd Why: Why are passwords being rejected? Because the system doesn’t recognize them.
• 3rd Why: Why doesn’t the system recognize them? Because some users are resetting their passwords repeatedly.
• 4th Why: Why are they resetting their passwords repeatedly? Because they can’t remember them.
• 5th Why: Why can’t they remember their passwords? Because the system has strict password requirements that are hard to remember.
• Solution: Implement a more user-friendly password recovery system or use passwordless login methods like biometrics or magic links.
The 5 Whys technique helps digital support services dig deeper to find solutions that aren’t just quick fixes but address the real problem, saving time and improving user experiences in the long run.
5 Whys Game
Objective:
This activity helps students understand the 5 Whys technique by creating a game where they identify the root cause of a problem. It encourages teamwork, critical thinking, and communication skills.
Setup:
• Split the class into pairs (Pair A and Pair B).
• Each pair will create a simple problem scenario and guide the other pair through the 5 Whys questioning process to find the root cause.
• After creating their scenarios, the pairs will swap and solve each other’s problem using the 5 Whys method.
Instructions:
Part 1: Creating the Problem Scenario (10-15 minutes)
1. Create a Problem: In each pair, students come up with a fictional problem for the other pair to solve. The problem should be related to everyday experiences like technology, school, or a common inconvenience. The problem can be simple, such as:
• “The Wi-Fi isn’t working.”
• “A game console keeps freezing.”
• “The printer won’t print.”
2. Think of the Root Cause: After creating the problem, the pair should also come up with a potential root cause of the issue (e.g. Wi-Fi router is out of date, or the console needs an update) to make sure they can guide the other pair toward the answer.
3. Develop Hints: Prepare answers for each of the 5 Whys steps that will eventually lead to the root cause. Make sure the hints lead the problem-solvers to dig deeper, but don’t give away the solution immediately.
Example:
• Problem: “The laptop won’t turn on.”
• Why #1: Why isn’t the laptop turning on? (The battery is dead.)
• Why #2: Why is the battery dead? (It wasn’t charged overnight.)
• Why #3: Why wasn’t it charged overnight? (The charger wasn’t plugged in properly.)
• Why #4: Why wasn’t it plugged in properly? (The power strip was switched off.)
• Why #5: Why was the power strip switched off? (It was switched off to save power, but the student forgot to turn it back on before charging.)
Part 2: Swapping and Solving (10-15 minutes)
1. Swap Problems: Once both pairs have completed their problem scenarios, they swap with another pair. Now each group has a new problem to solve using the 5 Whys technique.
2. Solve the Problem:
• The pair solving the problem will ask “why” questions, starting with the surface problem.
• The other pair (the creators of the problem) will provide answers based on the hints they prepared.
• The goal is for the solvers to identify the root cause after asking at least 5 “why” questions.
3. Reflection: After solving, each pair should discuss:
• Did they reach the root cause? How difficult was it to ask the right “why” questions?
• Were the answers clear, or did they need more information?
• How did this process help them understand the problem better?
Part 3: Group Discussion (5-10 minutes)
After both pairs have completed the activity, come together as a class to reflect on the experience. Ask students:
• What challenges did they face when asking “why”?
• Did anyone find a different root cause than expected?
• How can this technique be useful in real life, especially in areas like technology or problem-solving?
Extensions:
• Role Reversal: Have the pairs switch roles again and create new problems.
• Real-World Scenarios: Ask pairs to think of real issues they’ve encountered in their daily lives (like a broken phone charger or app not working) and apply the 5 Whys.
This activity is designed to be fun, engaging, and hands-on, helping students apply the 5 Whys technique in a creative way while working together!
Failure mode and effects analysis (FMEA)
Identifies which parts of the process or system are faulty
In the digital support services industry, Failure Mode and Effects Analysis (FMEA) can be highly valuable in ensuring reliability, minimising downtime, and improving the overall customer experience. The industry relies on complex digital systems, software platforms, and networks, where failures can have significant operational and business impacts. Here’s how FMEA can be contextualised within this sector:
1. Failure Modes in Digital Support Services
• Software Failures: These could include bugs, crashes, or incompatibilities in the software used to provide support services. A failure might prevent users from accessing critical support tools or resources.
• Network Downtime: Disruptions in network connectivity that hinder communication between support teams and customers, leading to delays in problem resolution.
• Data Breaches or Cybersecurity Issues: Failures in protecting customer data can lead to breaches, data loss, or unauthorised access, which are critical in digital services.
• Poor Integration: Incompatibility between various software systems or tools used in support services, causing disruptions in the workflow or poor user experiences.
2. Effects of Failure
• Customer Dissatisfaction: Failures can lead to delays in resolving customer issues, causing frustration and possibly losing customers.
• Operational Downtime: Extended periods of system unavailability affect the ability of the support team to operate efficiently, impacting overall service delivery.
• Reputation Damage: Cybersecurity issues or consistent service failures can damage the organisation’s reputation, eroding trust with clients.
• Financial Losses: Unplanned outages, lost productivity, and reputational damage can lead to financial consequences, either through lost business opportunities or costs associated with fixing the issues.
3. Severity, Occurrence, and Detection in Digital Support Services
• Severity (S): For digital support services, severity can range from minor inconveniences (e.g., slow service) to critical issues such as complete system shutdowns, impacting service-level agreements (SLAs).
• Occurrence (O): In a digital environment, failure modes with high occurrence might include recurring software bugs, frequent network interruptions, or continual user-reported issues.
• Detection (D): Early detection of failure modes could involve automated monitoring tools, error logs, or customer feedback systems. Failures that are hard to detect, such as latent cybersecurity vulnerabilities, would rank high on the detection scale.
4. Risk Priority Number (RPN)
• In digital support services, the RPN helps identify where proactive improvements are most needed. For example, a failure mode such as a data breach, with high severity (due to legal and reputational risks), moderate occurrence, and low detectability, would have a high RPN. This would signal the need for immediate attention, such as implementing stronger cybersecurity measures or monitoring systems.
5. Mitigation and Prevention in Digital Support
• Automated Monitoring Tools: To minimise occurrences of network and software failures, companies can implement real-time monitoring systems that alert teams when failures are likely to occur.
• Redundant Systems: In the case of network downtime, having redundant systems or backup networks can ensure continued service even if the primary system fails.
• Patch Management and Software Updates: Regularly updating software and applying patches can prevent common bugs and vulnerabilities that lead to system failures.
• Cybersecurity Protocols: Stronger encryption, multi-factor authentication, and real-time threat detection can mitigate the risk of data breaches and security-related failures.
FMEA as a Learning Tool in Digital Support Services:
In this industry, FMEA becomes a proactive learning model for continuously improving digital infrastructure. By routinely analysing failure modes, companies can:
• Enhance their incident response protocols to minimise customer impact.
• Build resilience into their systems by identifying critical failure points before they cause major service disruptions.
• Foster continuous improvement in service delivery by learning from previous failures, which in turn improves customer satisfaction and operational efficiency.
FMEA helps digital support service providers identify and prioritise potential failures, mitigate risks, and enhance overall system reliability, which is crucial for maintaining high levels of service quality and customer trust.
Activity: Failure Mode and Effects Analysis (FMEA) in Digital Support Services
Duration: 30 minutes
Target Audience: IT Students
Failure Mode and Effects Analysis (FMEA) with an application in Digital Support Services
Activity Overview:
In this activity, students will apply the principles of FMEA to identify potential failure modes in a common Digital Support Services scenario, evaluate the impact, and develop strategies to mitigate these risks. This practical exercise will enhance their problem-solving skills and understanding of risk management in IT service delivery.
Learning Objectives:
• Understand the purpose and process of FMEA.
• Apply FMEA to a real-world Digital Support Services scenario.
• Identify failure modes, their effects, and possible mitigation strategies.
• Present findings in a structured manner.
Scenario: User Account Management System
You work in a Digital Support Services team responsible for managing a company’s User Account Management System. This system handles user account creation, password resets, role assignments, and account deactivation. Ensuring this service operates smoothly is critical to business continuity and user satisfaction.
Task Breakdown (30 minutes):
1. Introduction to FMEA (5 minutes):
• Brief overview of what FMEA is: A structured approach to identifying and evaluating potential failures in a process, system, or product and their effects.
• Explain how FMEA can be applied to Digital Support Services—e.g., improving system reliability, preventing service outages, and enhancing user experience.
2. Group Work: Failure Mode Identification (10 minutes):
Divide students into small groups (3-5 members). Each group will brainstorm potential failure modes in the User Account Management System.
Examples of Failure Modes:
• Incorrect password resets (users unable to reset their passwords due to system errors).
• Delayed account activation (users not receiving timely access to their accounts).
• Misassigned user roles (users receiving incorrect permissions).
• Security vulnerabilities (users gaining unauthorised access).
3. FMEA Analysis (10 minutes):
Each group will use the FMEA method to analyse one or two failure modes identified earlier.
For each failure mode, they must:
• Identify the potential effects (e.g., user frustration, system downtime).
• Rate the severity (how serious the effect is on the system or users) on a scale of 1 to 10.
• Identify the causes (e.g., human error, software bugs, incorrect configurations).
• Rate the occurrence (likelihood of the failure happening) on a scale of 1 to 10.
• Identify current controls (e.g., automated password reset system).
• Rate the detection (how likely the system can detect the failure before it occurs) on a scale of 1 to 10.
• Suggest improvements to reduce the risk of failure (e.g., better user training, enhanced system logging).
4. Presentation and Discussion (5 minutes):
Each group will present one failure mode and their FMEA analysis to the class, focusing on the failure’s severity, likelihood of occurrence, and proposed solutions. The instructor and other groups can ask questions and provide feedback.
Example to Support Understanding:
Failure Mode: Incorrect Password Resets
• Effect: Users are unable to access the system, leading to frustration, productivity loss, and increased support calls.
• Severity: 8 (high, since access is crucial for daily operations).
• Cause: Incorrect configuration of the password reset system or outdated email templates.
• Occurrence: 5 (moderate, occurs occasionally but not frequently).
• Current Controls: Automated password reset tool, email notifications.
• Detection: 6 (moderate, failures are reported by users, but the system does not automatically detect the issue).
• Suggested Improvement: Introduce a monitoring system that alerts support staff when password resets fail and implement regular audits of the reset tool.
Expected Outcome:
Students will gain a practical understanding of FMEA as a tool for improving Digital Support Services by identifying and addressing potential failure points. The exercise will also help them develop teamwork and presentation skills as they discuss their findings and propose solutions.
Materials Required:
• FMEA templates (paper or digital)
• Scenario description (provided in the activity)
• Whiteboard/flip chart for group presentations
Event tree analysis (ETA)
Event Tree Analysis (ETA) is a method used to evaluate how an event or failure could progress and what consequences it might lead to. It starts with a single event, called an “initiating event”, and from there, branches out like a tree, showing different possible outcomes. This analysis is especially useful in safety and risk assessments because it helps identify how different systems, processes, or actions can either stop or allow the event to get worse.
How ETA Works:
1. Identify the initiating event – This could be anything, from a system error to a power outage.
2. Identify the systems or processes designed to respond – For each step, there might be safety systems or processes that can either work (success) or fail (failure).
3. Create branches for each decision point – If something works, the branch leads to a positive outcome. If something fails, the branch leads to a more negative outcome.
4. Evaluate consequences – Each branch ends in a possible outcome, ranging from “nothing happens” to a serious failure.
Example Situations in Digital Support Services:
In digital support services, where businesses provide technical help and maintain digital infrastructure, ETA can help assess risks related to system failures or cyber-attacks.
Example 1: System Outage in a Cloud Service Provider
Imagine a situation where a cloud service provider (like Google Cloud or Amazon Web Services) experiences a major power
Activity:
Event Tree Analysis (ETA) in Digital Support Services
Objective:
To research and understand how Event Tree Analysis (ETA) can be applied in digital support services, particularly focusing on system failures, cyber-attacks, or technical errors. Students will present their findings in a 5-minute presentation, showing their understanding of ETA and how it applies to real-world scenarios.
Instructions:
1. Choose a Scenario:
• Select a situation in digital support services where ETA could be applied. Examples include:
• A cyber-attack on a company’s network.
• A system failure or outage in a cloud service provider.
• A technical error in a data centre causing partial downtime.
• Think about what the initiating event might be, and what the potential outcomes could be, based on whether systems work or fail.
2. Research ETA in Digital Systems:
• Spend 10-15 minutes researching the use of Event Tree Analysis in the context of digital systems. Use the following guiding questions:
• What is ETA, and how does it help assess risk?
• How does ETA apply in scenarios like system failures or cyber-attacks?
• What are some real-world examples where ETA has been used in digital services?
3. Sources for Research:
• Health and Safety Executive: Event Tree Analysis – A basic guide to ETA and how it works.
• ScienceDirect: Event Tree Analysis – A detailed overview of ETA and its applications.
• Cloud Computing Incidents Database – Real-world cases of cloud service outages and failures, which can be useful for examples.
• Cyber Security and Infrastructure Agency (CISA) – Information on cyber-attacks and system vulnerabilities.
4. Create a Presentation:
• Spend 15 minutes compiling your findings into a short presentation. Your presentation should include:
• A brief explanation of Event Tree Analysis.
• The scenario you selected (e.g., system failure, cyber-attack) and its potential consequences.
• A simple event tree diagram showing the possible outcomes (you can draw this or create it digitally).
• A conclusion explaining why ETA is useful in digital support services.
5. Presentation Requirements:
• The presentation should last 5 minutes.
• Be ready to explain your event tree and how you arrived at the possible outcomes.
• actions to take after using root cause analysis:
o log
o close
o escalate to an appropriate manager, specialist or external third party.
1.3.5 The process of the high-level problem-solving strategy:
A high-level problem-solving strategy is a structured, logical process used to diagnose, analyse, and resolve issues efficiently. In IT Support and Cyber Security, this approach is essential for ensuring faults are identified accurately, risks are managed appropriately, and solutions are implemented safely without causing further disruption. It helps technicians stay systematic and evidence-based especially when dealing with complex digital systems, networks, devices, and security incidents.
Below is a full explanation of each stage, followed by examples that link directly to Digital Support Services and Security operations.
Identify the Problem
This first stage focuses on gathering information about what is wrong. Technicians must determine the scope, symptoms, and impact of the fault.
In practice (IT Support example):
-
A user reports that their PC cannot access the network.
-
Support staff collect details:
-
Does the device see the Wi-Fi network?
-
Are other devices affected?
-
When did the issue begin?
-
Has anything changed (software update, new hardware, password expired)?
-
In practice (Security example):
-
SIEM alerts show unusual outbound traffic from a workstation.
-
Analysts identify whether this is expected behaviour or an indicator of compromise (IoC).
• gather information
Analyse the information
After gathering symptoms, you refine the problem into a clear definition. This avoids fixing the wrong issue.
In practice (IT Support example):
After testing, the root cause might be:
-
Network cable unplugged
-
Incorrect static IP address
-
DHCP server unavailable
In practice (Security example):
A phishing investigation identifies:
-
Compromised user credentials
-
Malicious script running in the background
-
User clicked an unsafe link
Make a plan of action
At this point, technicians brainstorm multiple potential fixes. These can include temporary workarounds or long-term solutions.
In practice (IT Support example):
For a PC that cannot join the domain:
-
Reset network adapter
-
Flush DNS
-
Rejoin the domain
-
Replace corrupted profile
-
Roll back the latest update
In practice (Security example):
For a credential compromise:
-
Force password reset
-
Remove suspicious log-ins
-
Block malicious IP addresses
-
Patch affected systems
-
Strengthen MFA for future prevention
Implement the Solution
The chosen solution is applied. IT support technicians must consider:
-
Change-control procedures
-
System downtime
-
Backups
-
Communication with stakeholders
IT Support Example:
-
Applying a Group Policy fix to a faulty set of PCs after notifying staff.
-
Installing the correct printer driver across a department.
Security Example:
-
Isolating a workstation from the network during incident response.
-
Rolling out a security patch across all devices.
Review the solution.
Not all solutions are equal. Technicians assess each based on feasibility, risk, cost, time, and impact on users.
IT Support Example:
To fix slow network speeds, options include:
-
Replace damaged cabling (long-term fix)
-
Restart the switch (quick fix but may cause downtime)
-
Change user’s port (minimal disruption)
The technician chooses the option that balances effectiveness and minimal business impact.
Security Example:
For malware detected on a server, options could include:
-
Clean the infection
-
Restore from a timestamped backup
-
Rebuild the server from scratch
If the malware is unknown or persistent, rebuilding the server may be the safest option despite being time-consuming.
1.3.6 The definition of a digital incident, in incident management:
• a single unplanned event
• that disrupts service operations
• that negatively impacts service quality
1.3.7 The definition of a digital problem, in incident management, as the cause of the incident.
1.3.8 The process of incident management:
• detection: report, record, prioritise
• response: identify owner, resolve and restore, record resolution
• intelligence: record lessons, identify cause, share lessons.
1.3.9 The interrelationships between problems and problem-solving strategies and make judgements about the suitability of strategies for solving the problems in digital support and security
Files that support this week